6. Histogram_2d plot
6.1. Description
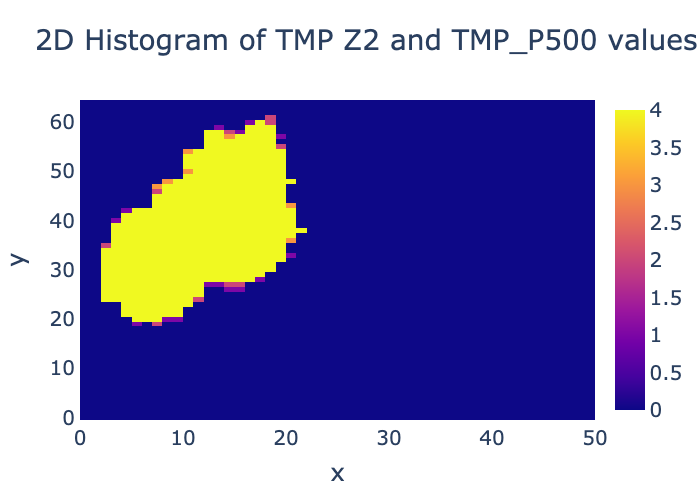
The output from the MET grid_diag tool can be visualized as a 2D-histogram by invoking the histogram_2d.py plotting script from the command line.
For more information about the MET grid_diag tool, please refer to the documentation:
https://met.readthedocs.io/en/latest/Users_Guide/grid-diag.html
6.2. Example
Sample Data
The sample data used to create an example 2d histogram is available in the METplotpy repository, where the histogram_2d.py code is located:
$METPLOTPY_SOURCE/METplotpy/metplotpy/test/histogram_2d/histogram_2d.py
$METPLOTPY_SOURCE is the directory where the METplotpy code is saved. The data is text output from the MET grid_diag tool, in netCDF format.
Configuration File
The histogram_2d utilizes a default YAML configuration file to indicate the plot attributes such as titles, the plot size, the output plot name, and the variable of interest to plot. The input data file and directory are specified at the command line. The default configuration file, histogram_2d_defaults.yaml is found in the $METPLOTPY_SOURCE/METplotpy/metplotpy/plots/config directory. $METPLOTPY_SOURCE is the user-specified directory where the METplotpy source code has been saved. To customize the plot attributes, make the necessary changes in the histogram_2d_defaults.yaml config file.
6.3. Run from the Command Line
The histogram_2d_defaults.yaml configuration file, in combination with the grid_diag_temperature.nc netCDF data file (generated from the MET tool grid_diag), generates a 2D-histogram plot of the hist_TMP_Z2_TMP_P500 variable:
To generate the above plot using the histogram_2d_defaults.yaml config file and the grid_diag_temperature.nc netCDF file (which was generated from the MET tool grid_diag), perform these steps:
if you are working within a conda environment, activate the conda environment that has the required Python packages outlined in the installation section
clone the METplotpy repository from GitHub:
mkdir $METPLOTPY_SRC_DIRwhere $METPLOTPY_SRC_DIR is the directory where you wish to save the code
cd $METPLOTPY_SRC_DIR
git clone https://github.com/dtcenter/METplotpy
set your PYTHONPATH to point to the location of the METplotpy code:
for csh:
setenv PYTHONPATH $METPLOTPY_SRC_DIR/metplotpy:$METPLOTPY_SRC_DIR/metplotpy/plotsfor ksh:
export PYTHONPATH=$METPLOTPY_SRC_DIR/metplotpy:$METPLOTPY_SRC_DIR/metplotpy/plotsreplace $METPLOTPY_SRC_DIR with the directory where you saved the source code
cd to the $METPLOTPY_SOURCE/METplotpy/metplotpy/plots/histogram_2d directory
enter the following command at the command line:
python histogram_2d.py --input grid_diag_temperature.nc --datadir $METPLOTPY_SOURCE/METplotpy/metplotpy/plots/histogram_2da tmp_z2_p500.png output file will be created in the $METPLOTPY_SOURCE/METplotpy/metplotpy/plots/histogram_2d directory, as specified by the histogram_2d_defaults.yaml plot_filename setting.