2. Line plot
2.1. Description
The line plot is a scatter plot where each point is connected by a line. It is used by METviewer for generating series plots. Refer to the METviewer documentation for details on how this plot is utilized:
https://metviewer.readthedocs.io/en/latest/Users_Guide/seriesplots.html
2.2. Example
Sample Data
The sample data used to create an example line plot is available in the METplotpy repository, where the line plot tests are located:
$METPLOTPY_SOURCE/METplotpy/metplotpy/test/line/line.data
$METPLOTPY_SOURCE is the directory where the METplotpy code is saved. The data is text output from MET in columnar format.
Configuration Files
The line plot utilizes YAML configuration files to indicate where input data is located and to set plot attributes. These plot attributes correspond to values that can be set via the METviewer tool. YAML is a recursive acroynym for “YAML Ain’t Markup Language” and according to yaml.org, it is a “human-readable data-serialization language”. It is commonly used for configuration files and in applications where data is being stored or transmitted”. Two configuration files are required, the first is a default configuration file, line_defaults.yaml that is found in the $METPLOTPY_SOURCE/METplotpy/metplotpy/plots/config directory. All default configuration files are located in the $METPLOTPY_SOURCE/METplotpy/metplotpy/plots/config directory. Note, $METPLOTPY_SOURCE is the user-specified directory where the METplotpy source code has been saved. The second required YAML configuration file is a user-supplied “custom” configuration file that is used to customize/override the default settings in the line_defaults.yaml file. The custom configuration file can be an empty file if all default settings are to be applied.
2.3. METplus Configuration
Default Configuration File
The following is the mandatory, line_defaults.yaml configuration file, which serves as a good starting point for creating a line plot as it represents the default values set in METviewer
alpha: 0.05
box_avg: 'False'
box_boxwex: 0.2
box_notch: 'False'
box_outline: 'True'
box_pts: 'False'
caption_align: 0
caption_col: '#333333'
caption_offset: 3
caption_size: 0.8
caption_weight: 1
cex: 1
colors: []
con_series: []
derived_series_1: []
derived_series_2: []
dump_points_1: 'False'
dump_points_2: 'False'
event_equal: 'False'
fcst_var_val_1: {}
fcst_var_val_2: {}
fixed_vars_vals_input: {}
grid_col: '#f5274a'
grid_lty: 3
grid_lwd: 1
grid_on: 'True'
grid_x: listX
indy_stagger_1: 'False'
indy_stagger_2: 'False'
indy_vals: []
indy_var: ''
legend_box: o
legend_inset:
  x: 0.0
  y: -0.25
legend_ncol: 3
legend_size: 0.8
line_type: N/A
list_stat_1: []
list_stat_2: []
list_static_val: {}
mar:
- 8
- 4
- 5
- 4
method: ''
mgp:
- 1
- 1
- 0
num_iterations: 1
num_threads: -1
plot_ci: []
plot_disp: []
plot_filename: /tmp/line.png
plot_height: 8.5
plot_res: 72
plot_stat: median
plot_type: png16m
plot_units: in
plot_width: 11.0
random_seed: null
series_line_style: []
series_line_width: []
series_order: []
series_symbols: []
series_type: []
series_val_1: {}
series_val_2: {}
show_nstats: 'False'
show_signif: []
stat_input: ../line/line.data
sync_yaxes: 'False'
title: test title
title_align: 0.5
title_offset: -2
title_size: 1.4
title_weight: 2.0
user_legend: []
variance_inflation_factor: 'True'
vert_plot: 'False'
x2lab_align: 0.5
x2lab_offset: -0.5
x2lab_size: 0.8
x2lab_weight: 1
x2tlab_horiz: 0.5
x2tlab_orient: 1
x2tlab_perp: 1
x2tlab_size: 0.8
xaxis: test x_label
xaxis_reverse: 'False'
xlab_align: 0.5
xlab_offset: 2
xlab_size: 1
xlab_weight: 1
xlim: []
xtlab_decim: 0
xtlab_horiz: 0.5
xtlab_orient: 1
xtlab_perp: -0.75
xtlab_size: 1
y2lab_align: 0.5
y2lab_offset: 1
y2lab_size: 1
y2lab_weight: 1
y2lim: []
y2tlab_horiz: 0.5
y2tlab_orient: 1
y2tlab_perp: 1
y2tlab_size: 1.0
yaxis_1: test y_label
yaxis_2: ''
ylab_align: 0.5
ylab_offset: -2
ylab_size: 1
ylab_weight: 1
ylim: []
ytlab_horiz: 0.5
ytlab_orient: 1
ytlab_perp: 0.5
ytlab_size: 1
Custom Configuration File
A second, mandatory configuration file is required, which is used to customize the settings to the line plot. The custom_line.yaml file is included with the source code. If the user wishes to use all the default settings defined in the line_defaults.yaml file, an empty custom configuration file can be specified instead.
colors:
- '#ff0000'
- '#55ff00'
- '#00aaff'
- '#0040ff'
- '#c3ff00'
con_series:
- 1
- 1
- 1
- 1
- 1
create_html: 'False'
derived_series_1:
- - CONTROL RH MAE
  - GTS RH MAE
  - DIFF
derived_series_2: []
dump_points_1: 'True'
dump_points_2: 'True'
event_equal: 'True'
fcst_var_val_1:
  RH:
  - MAE
fcst_var_val_2:
  TMP:
  - ME
fixed_vars_vals_input:
  fcst_lev:
    fcst_lev_0:
    - Z02
grid_col: '#cccccc'
grid_lty: 3
grid_lwd: 1
grid_on: 'True'
grid_x: listX
indy_label:
- '6'
- '12'
- '18'
indy_stagger_1: 'True'
indy_stagger_2: 'False'
indy_vals:
- '60000'
- '120000'
- '180000'
indy_var: fcst_lead
legend_box: o
legend_inset:
  x: 0.0
  y: -0.25
legend_ncol: 3
legend_size: 0.8
line_type: None
list_stat_1:
- MAE
list_stat_2:
- ME
list_static_val:
  fcst_var: ME
mar:
- 8
- 4
- 5
- 4
method: bca
mgp:
- 1
- 1
- 0
num_iterations: 1
num_threads: -1
plot_caption: Caption
plot_ci:
- std
- std
- std
- std
- std
plot_disp:
- 'True'
- 'True'
- 'True'
- 'True'
- 'True'
plot_filename: ./line.png
plot_height: 8.5
plot_res: 72
plot_stat: median
plot_type: png16m
plot_units: in
plot_width: 11.0
random_seed: null
series_line_style:
- '-'
- '-'
- '-'
- '-'
- '-'
series_line_width:
- 1
- 1
- 1
- 1
- 1
series_order:
- 1
- 2
- 3
- 4
- 5
series_symbols:
- .
- .
- .
- .
- .
series_type:
- b
- b
- b
- b
- b
series_val_1:
  model:
  - CONTROL
  - GTS
series_val_2:
  model:
  - CONTROL
  - GTS
show_nstats: 'True'
show_signif:
- 'False'
- 'False'
- 'False'
- 'False'
- 'False'
stat_input: ../../../test/line/line.data
sync_yaxes: 'False'
title: test title
title_align: 0.5
title_offset: -2
title_size: 1.4
title_weight: 2.0
user_legend: []
variance_inflation_factor: 'False'
vert_plot: 'False'
x2lab_align: 0.5
x2lab_offset: -0.5
x2lab_size: 0.8
x2lab_weight: 1
x2tlab_horiz: 0.5
x2tlab_orient: 1
x2tlab_perp: 1
x2tlab_size: 0.8
xaxis: test x_label
xaxis_reverse: 'False'
xlab_align: 0.5
xlab_offset: 2
xlab_size: 1
xlab_weight: 1
xlim: []
xtlab_decim: 0
xtlab_horiz: 0.5
xtlab_orient: 1
xtlab_perp: -0.75
xtlab_size: 1
y2lab_align: 0.5
y2lab_offset: 1
y2lab_size: 1
y2lab_weight: 1
y2lim: []
y2tlab_horiz: 0.5
y2tlab_orient: 1
y2tlab_perp: 1
y2tlab_size: 1.0
yaxis_1: test y_label
yaxis_2: ''
ylab_align: 0.5
ylab_offset: -2
ylab_size: 1
ylab_weight: 1
ylim: []
ytlab_horiz: 0.5
ytlab_orient: 1
ytlab_perp: 0.5
ytlab_size: 1
2.4. Run from the Command Line
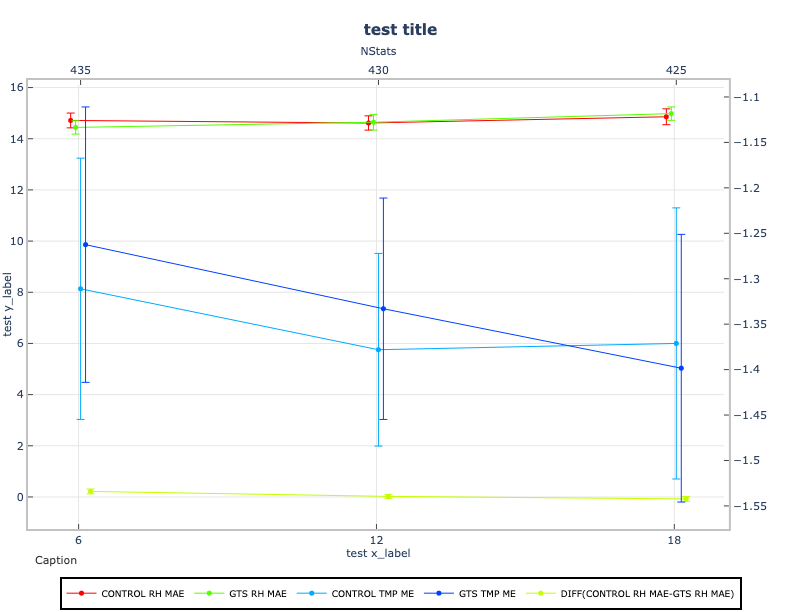
The custom_line.yaml configuration file, in combination with the line_defaults.yaml configuration file, generate a plot of five series:
To generate the above plot using the line_defaults.yaml and custom_line.yaml config files, perform the following:
verify that you are running in the conda environment that has the required Python packages outlined in the requirements section
cd to the $METPLOTPY_SOURCE/METplotpy/metplotpy/plots/line directory
enter the following command:
python line.py ./custom_line.yamla line.png output file will be created in the $METPLOTPY_SOURCE/METplotpy/metplotpy/plots/line directory, as specified by the custom_line.yaml plot_filename value.
in addition, a line.point1 (<outputfilename>.point1) text file is also generated, which lists the independent and dependent variables that are plotted. This information can be useful in debugging.