4. Reliability Diagram
4.1. Description
Reliability diagrams are useful in displaying the conditional bias of probabilistic forecasts. For more information about reliability diagrams, refer to the METviewer documentation:
https://metviewer.readthedocs.io/en/latest/Users_Guide/reliabilityplots.html
4.2. Example
Sample Data
The sample data used to create an example reliability diagram is available in the METplotpy repository, where the reliabilty diagram code is located:
$METPLOTPY_SOURCE/METplotpy/metplotpy/test/reliability_diagram/plot_20210311_145053.data
$METPLOTPY_SOURCE is the directory where the METplotpy code is saved. The data is text output from MET in columnar format.
Configuration Files
The reliability diagram utilizes YAML configuration files to indicate where input data is located and to set plot attributes. These plot attributes correspond to values that can be set via the METviewer tool. YAML is a recursive acroynym for “YAML Ain’t Markup Language” and according to yaml.org, it is a “human-readable data-serialization language”. It is commonly used for configuration files and in applications where data is being stored or transmitted”. Two configuration files are required, the first is a default configuration file, reliability_defaults.yaml that is found in the $METPLOTPY_SOURCE/METplotpy/metplotpy/plots/config directory. All default configuration files are located in the $METPLOTPY_SOURCE/METplotpy/metplotpy/plots/config directory. Note, $METPLOTPY_SOURCE is the user-specified directory where the METplotpy source code has been saved. The second required YAML configuration file is a user-supplied “custom” configuration file that is used to customize/override the default settings in the reliability_defaults.yaml file. The custom configuration file can be an empty file if all default settings are to be applied.
4.3. METplotpy Configuration
Default Configuration File
The following is the mandatory, reliability_defaults.yaml configuration file, which serves as a good starting point for creating a reliability diagram plot as it represents the default values set in METviewer
add_noskill_line: 'True'
add_reference_line: 'True'
add_skill_line: 'True'
alpha: 0.05
box_avg: 'False'
box_boxwex: 0.2
box_notch: 'False'
box_outline: 'True'
box_pts: 'False'
caption_align: 0.0
caption_col: '#333333'
caption_offset: 3.0
caption_size: 0.8
caption_weight: 1
cex: 1
circular_block_bootstrap: 'True'
colors:
- '#ff0000'
con_series:
- 1
create_html: 'True'
derived_series_1: []
derived_series_2: []
dump_points_1: 'False'
dump_points_2: 'False'
event_equal: 'False'
fcst_var_val_1:
  PROB(APCP_03>1.270):
  - PSTD_CALIBRATION
  - PSTD_BASER
  - PSTD_NI
fcst_var_val_2: null
fixed_vars_vals_input: {}
grid_col: '#cccccc'
grid_lty: 3
grid_lwd: 1
grid_on: 'True'
grid_x: listX
indy_label: []
indy_stagger_1: 'False'
indy_stagger_2: 'False'
indy_vals:
- '0'
- '0.1'
- '0.2'
- '0.3'
- '0.4'
- '0.5'
- '0.6'
- '0.7'
- '0.8'
- '0.9'
indy_var: thresh_i
inset_hist: 'True'
legend_box: o
legend_inset:
  x: 0.0
  y: -0.25
legend_ncol: 3
legend_size: 0.8
line_type: pct
list_stat_1:
- PSTD_CALIBRATION
- PSTD_BASER
- PSTD_NI
list_stat_2: []
list_static_val:
  fcst_var: PROB(APCP_03>1.270)
mar:
- 8
- 4
- 5
- 4
method: perc
mgp:
- 1
- 1
- 0
num_iterations: 1
num_threads: -1
plot_caption: ''
plot_ci:
- none
plot_disp:
- 'True'
plot_filename: ./default_reliability_diagram.png
plot_height: 8.5
plot_res: 72
plot_stat: median
plot_type: png16m
plot_units: in
plot_width: 11.0
random_seed: null
rely_event_hist: 'True'
series_line_style:
- '-'
series_line_width:
- 1
series_order:
- 1
series_symbols:
- .
series_type:
- b
series_val_1: {}
series_val_2: {}
show_nstats: 'False'
show_signif:
- 'False'
stat_input: ./plot_20210311_145053.data
summary_curves: []
sync_yaxes: 'False'
title: test title
title_align: 0.5
title_offset: -2
title_size: 1.4
title_weight: 2.0
user_legend: []
variance_inflation_factor: 'True'
vert_plot: 'False'
x2lab_align: 0.5
x2lab_offset: -0.5
x2lab_size: 0.8
x2lab_weight: 1
x2tlab_horiz: 0.5
x2tlab_orient: 1
x2tlab_perp: 1
x2tlab_size: 0.8
xaxis: test x_label
xaxis_reverse: 'False'
xlab_align: 0.5
xlab_offset: 2
xlab_size: 1
xlab_weight: 1
xlim: []
xtlab_decim: 0
xtlab_horiz: 0.5
xtlab_orient: 1
xtlab_perp: -0.75
xtlab_size: 1
y2lab_align: 0.5
y2lab_offset: 1
y2lab_size: 1
y2lab_weight: 1
y2lim: []
y2tlab_horiz: 0.5
y2tlab_orient: 1
y2tlab_perp: 1
y2tlab_size: 1.0
yaxis_1: test y_label
yaxis_2: ''
ylab_align: 0.5
ylab_offset: -2
ylab_size: 1
ylab_weight: 1
ylim: []
ytlab_horiz: 0.5
ytlab_orient: 1
ytlab_perp: 0.5
ytlab_size: 1
Custom Configuration File
A second, mandatory configuration file is required, which is used to customize the settings to the reliability diagram plot. The custom_reliability.yaml file is included with the source code an looks like the following:
add_noskill_line: 'True'
add_reference_line: 'True'
add_skill_line: 'True'
alpha: 0.05
box_avg: 'False'
box_boxwex: 0.2
box_notch: 'False'
box_outline: 'True'
box_pts: 'False'
caption_align: 0.0
caption_col: '#333333'
caption_offset: 3.0
caption_size: 0.8
caption_weight: 1
cex: 1
circular_block_bootstrap: 'True'
colors:
- 'blue'
con_series:
- 1
create_html: 'True'
derived_series_1: []
derived_series_2: []
dump_points_1: 'False'
dump_points_2: 'False'
event_equal: 'False'
fcst_var_val_1:
  PROB(APCP_03>1.270):
  - PSTD_CALIBRATION
  - PSTD_BASER
  - PSTD_NI
fcst_var_val_2: null
fixed_vars_vals_input: {}
grid_col: '#cccccc'
grid_lty: 3
grid_lwd: 1
grid_on: 'True'
grid_x: listX
indy_label: []
indy_stagger_1: 'False'
indy_stagger_2: 'False'
indy_vals:
- '0'
- '0.1'
- '0.2'
- '0.3'
- '0.4'
- '0.5'
- '0.6'
- '0.7'
- '0.8'
- '0.9'
indy_var: thresh_i
inset_hist: 'True'
legend_box: o
legend_inset:
  x: 0.0
  y: -0.25
legend_ncol: 3
legend_size: 0.8
line_type: pct
list_stat_1:
- PSTD_CALIBRATION
- PSTD_BASER
- PSTD_NI
list_stat_2: []
list_static_val:
  fcst_var: PROB(APCP_03>1.270)
mar:
- 8
- 4
- 5
- 4
method: perc
mgp:
- 1
- 1
- 0
num_iterations: 1
num_threads: -1
plot_caption: ''
plot_ci:
- none
plot_disp:
- 'True'
plot_filename: ./custom_reliability_diagram.png
plot_height: 8.5
plot_res: 72
plot_stat: median
plot_type: png16m
plot_units: in
plot_width: 11.0
random_seed: null
rely_event_hist: 'True'
series_line_style:
- '-'
series_line_width:
- 1
series_order:
- 1
series_symbols:
- .
series_type:
- b
series_val_1: {}
series_val_2: {}
show_nstats: 'False'
show_signif:
- 'False'
stat_input: ./plot_20210311_145053.data
summary_curves: []
sync_yaxes: 'False'
title: test title
title_align: 0.5
title_offset: -2
title_size: 1.4
title_weight: 2.0
user_legend: []
variance_inflation_factor: 'True'
vert_plot: 'False'
x2lab_align: 0.5
x2lab_offset: -0.5
x2lab_size: 0.8
x2lab_weight: 1
x2tlab_horiz: 0.5
x2tlab_orient: 1
x2tlab_perp: 1
x2tlab_size: 0.8
xaxis: test x_label
xaxis_reverse: 'False'
xlab_align: 0.5
xlab_offset: 2
xlab_size: 1
xlab_weight: 1
xlim: []
xtlab_decim: 0
xtlab_horiz: 0.5
xtlab_orient: 1
xtlab_perp: -0.75
xtlab_size: 1
y2lab_align: 0.5
y2lab_offset: 1
y2lab_size: 1
y2lab_weight: 1
y2lim: []
y2tlab_horiz: 0.5
y2tlab_orient: 1
y2tlab_perp: 1
y2tlab_size: 1.0
yaxis_1: test y_label
yaxis_2: ''
ylab_align: 0.5
ylab_offset: -2
ylab_size: 1
ylab_weight: 1
ylim: []
ytlab_horiz: 0.5
ytlab_orient: 1
ytlab_perp: 0.5
ytlab_size: 1
If the user wishes to use all the default settings defined in the reliability_defaults.yaml file, an empty custom configuration file (custom_reliability_use_defaults.yaml) can be specified instead:
# empty config file, use all settings defined in the default config file
4.4. Run from the Command Line
The reliability diagram plot that uses only the default values defined in the reliability_defaults.yaml configuration file looks like the following:
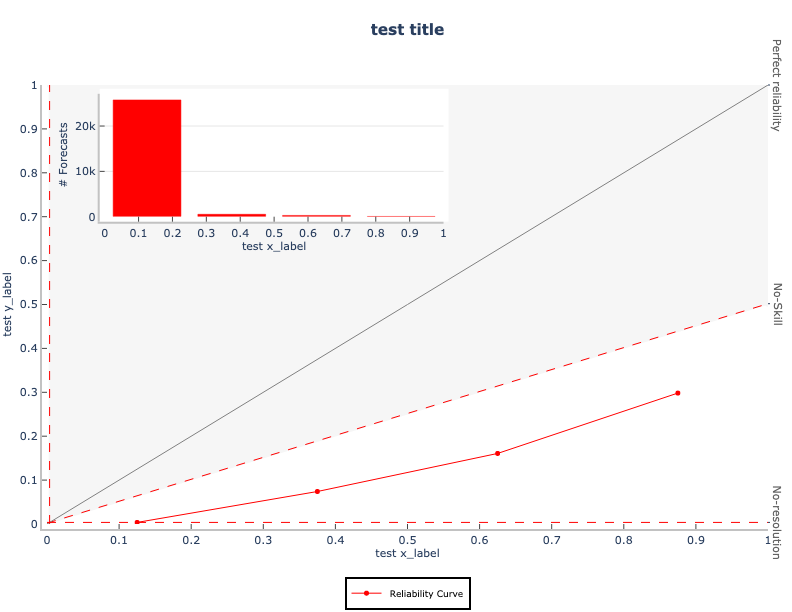
To generate the above plot, use the reliability_defaults.yaml and the empty custom configuration file, custom_reliability_use_defaults.yaml config files. Then, perform the following:
verify that you are running in the conda environment that has the required Python packages outlined in the requirements section
cd to the $METPLOTPY_SOURCE/METplotpy/metplotpy/plots/reliability_diagram directory
enter the following command:
python reliability.py ./custom_reliability_use_defaults.yamla default_reliability_diagram.png output file will be created in the $METPLOTPY_SOURCE/METplotpy/metplotpy/plots/reliability_diagram directory. The filename is specified by the plot_filename value in the reliability_defaults.yaml config file.
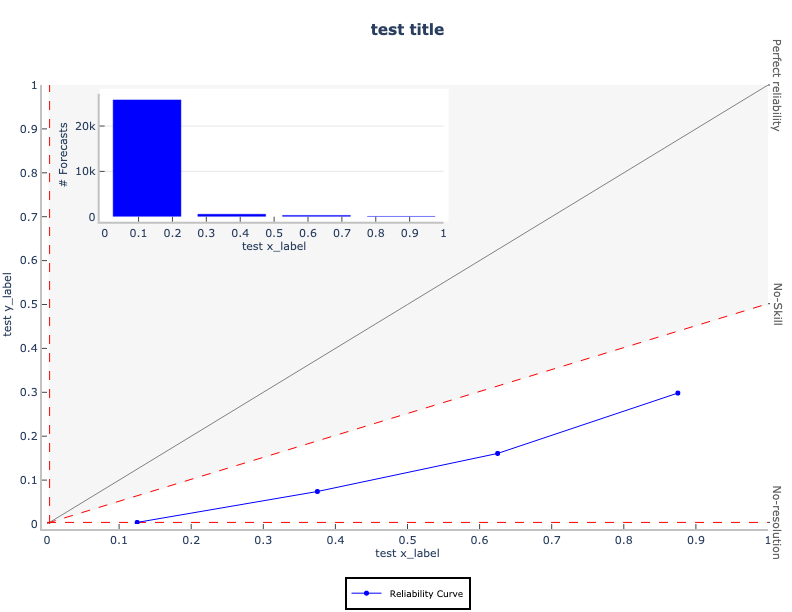
To generate a customized reliability diagram, use the custom_reliability_diagram.yaml config file.
enter the following command:
python reliability.py ./custom_reliability_diagram.yaml
In this example, this custom config file changes the color of the boxes.
in addition, a .point1 (<outputfilename>.point1) text file is also generated, which lists the independent and dependent variables that are plotted. This information can be useful in debugging.