5. ROC diagram
5.1. Description
ROC (Receiver Operating Characteristic) curves are useful in weather forecasting. ROC curve plots show the true positive rate (sensitivity) versus the false positive rate (1 - specificity) for different cut-off points of a parameter. In addition to creating ROC diagrams directly from the source code in the METplotpy repository, ROC diagrams can be generated through METviewer. For more information on ROC diagrams, please refer to the METviewer documentation:
https://metviewer.readthedocs.io/en/latest/Users_Guide/rocplot.html
5.2. Example
Sample Data
Sample data used to create an example ROC diagram is available in the METplotpy repository, where the ROC diagram code is located:
$METPLOTPY_SOURCE/METplotpy/metplotpy/plots/roc_diagram/ plot_20200507_074426.data
Configuration Files
The ROC diagram utilizes YAML configuration files to indicate where input data is located and to set plot attributes. These plot attributes correspond to values that can be set via the METviewer tool. YAML is a recursive acroynym for “YAML Ain’t Markup Language” and according to yaml.org, it is a “human-readable data-serialization language”. It is commonly used for configuration files and in applications where data is being stored or transmitted”. Two configuration files are required, the first is a default configuration file, reliability_defaults.yaml that is found in the $METPLOTPY_SOURCE/METplotpy/metplotpy/plots/config directory. All default configuration files are located in the $METPLOTPY_SOURCE/METplotpy/metplotpy/plots/config directory. $METPLOTPY_SOURCE is the user-specified directory where the METplotpy source code has been saved. The second required YAML configuration file is a user-supplied “custom” configuration file that is used to customize/override the default settings in the reliability_defaults.yaml file. The custom configuration file can be an empty file if all default settings are to be applied.
5.3. METplus Configuration
Default Configuration File
The following is the mandatory, roc_diagram_defaults.yaml configuration file, which serves as a good starting point for creating a ROC diagram plot as it represents the default values set in METviewer
---
# Default settings specific to ROC diagram plot
# Line and marker plots of false alarm rate (x-axis) vs probability of detection (y-axis).

# Title settings
title: ROC CTC # required
title_align:  0.5 # optional
title_offset: -2 #required
title_size: 1.4 #required
title_weight: 2.0 #required


plot_width: 11 #required
plot_height: 8.5 #required
plot_res: 7 #required
plot_units:  in #required

# one of the following MUST be set to False whilst the other
# is set to True.  Both MUST be set to a boolean value.
roc_pct: False
roc_ctc: True

add_point_thresholds: True  #optional

series_val_1: {}
series_val_2:   {}

fcst_var_val_1: {}  #optional
fcst_var_val_2: {}  #optional

indy_var:    'fcst_valid_beg'
indy_vals:    #optional

user_legend:
  #user_legend:
  - 'CTC ROC'

# Required setting. Two types supported, 'n' for none and 'o' for box
legend_box: 'n'
# number of columns in legend
legend_ncol: 3 #optional
legend_inset:
  x: 0.  #required
  y: -0.14 #required
legend_size: 0.8  #required

line_type: N/A

plot_disp:
  - True #required
series_order:
  - 1  #required
stat_curve: 'None' #required

colors:
  -  "#8000ff" #optional
series_symbols:
  -  "Small circle" #required
series_line_width:
  -  1  #optional
series_type:
  - "joined lines" #optional

series_line_style:
  # solid line
  -  "-" #optional

# Perform event equalization to check for missing data
event_equal: True #False

# Caption settings
plot_caption: "This is caption" #required, set to empty string if no caption text
caption_weight: 1 #optional
caption_col: "#333333" #optional
caption_size: 0.8 # relative magnification, required
caption_offset: 3  # axis perpendicular location adjustment, required
caption_align: 0 # axis parallel location adjustment, required

# X1 axis settings
xaxis: test x_label #required
# unsupported by Python plotting
xlab_align: 0.5 #not used for this plot
xlab_offset: 2 #required
xlab_size: 1 #required
xlab_weight: 1 #optional
xlim: [] #optional
xtlab_decim: 0 #optional
xtlab_horiz: 0.5 #optional
xtlab_orient: 1 #optional
xtlab_perp: -0.75 #optional
xtlab_size: 1 #required

# Y1 axis settings
yaxis_1: test y_label #required, set to empty string if no label
yaxis_2: '' #required, set to empty string if no label
#unsupported by Python plotting
ylab_align: 0.5 #unused by this plot
ylab_offset: -2 #required
ylab_size: 1 #required
ylab_weight: 1 #optional
ylim: [] #optional
ytlab_horiz: 0.5 #optional
ytlab_orient: 1 #optional
ytlab_perp: 0.5 #optional
ytlab_size: 1 #required

create_html: True  #optional
stat_input:  ./plot_20200507_074426.data #required
plot_filename: ./roc_diagram_default.png #required
Custom Configuration File
A second, mandatory configuration file is required, which is used to customize the settings to the ROC diagram plot. The custom_reliability.yaml file is included with the source code and looks like the following:
---
roc_pct: False
roc_ctc: True

reverse_connection_order: False

series_val_1: {}
series_val_2: {}

plot_disp:
    - True
series_order:
    - 1
stat_curve: 'None'
add_point_thresholds: False
event_equal: True
title: "Custom: ROC PCT 20200507_074426 "
# value of 0.5 centers the title, smaller values moves text to the left
title_align: 0.3
# -2 locates title at top, -1.5 puts title inside plotting region
title_offset: -2
# font size multiplier
title_size: 1.5
#1=plain text, 2=bold,3=italic,4=bold italic
title_weight: 4

xaxis: Custom POFD #"POFD (False Detection Rate)"
yaxis_1: "PODY Custom"

# X1 axis settings
xlab_size:  1.75
xlab_weight: 2
xlab_offset: 0
xtlab_horiz: 0.5
xtlab_orient: 2
xtlab_size: 1.2

# Y1 axis settings
ylab_size: 2.5
ylab_weight: 1
ylab_offset: 0
# orientation: 0=-90 degrees, 1=0 degrees, 2=0 degrees, 3=-90 degrees
ytlab_orient: 1
ytlab_size: 0.9

plot_width: 6
plot_height: 6
plot_res: 72
plot_units: in

colors:
    - "#8000ff"
series_symbols:
    - "Small circle"
series_type:
    - 'joined lines'
series_line_style:
    - 'solid'
series_line_width:
    - 1
user_legend:
  - 'CTC ROC'

legend_size: 0.8 # relative magnification
legend_box: 'o' # legend box type - o: box, n: none
legend_inset:
  x: 0.
  y: -0.14

plot_caption: "This is caption"
# weight of text: 1=plain text, 2=bold, 3=italic, 4=bold italic
caption_weight: 3
# caption text color
caption_col: "#ff4444"
caption_size: 1.2 # relative magnification
#up-down position of caption text
caption_offset: 2.9 #3  # axis perpendicular location adjustment
#left-right positioning of caption. Reasonable values are between 0 and 1: 0=leftmost,1=rightmost
caption_align: .1 #0 # axis parallel location adjustment

# Make the plot generated in METviewer interactive
create_html: 'True'
stat_input:  ./plot_20200507_074426.data
plot_filename: ./roc_diagram_custom.png
If the user wishes to use all the default settings defined in the roc_diagram_defaults.yaml file, an empty custom configuration file (minimal_roc_diagram_defaults.yaml) can be specified instead:
---
# This is the minimal configuration file you must provide
# If there is no content, as we have here, then all the
# settings in the default config file, roc_diagram_defaults.yaml
# will be employed.  A plot named roc_diagram_default.png will be
# created.
5.4. Run from the Command Line
The ROC diagram plot that uses only the default values defined in the roc_diagram_defaults.yaml configuration file looks like the following:
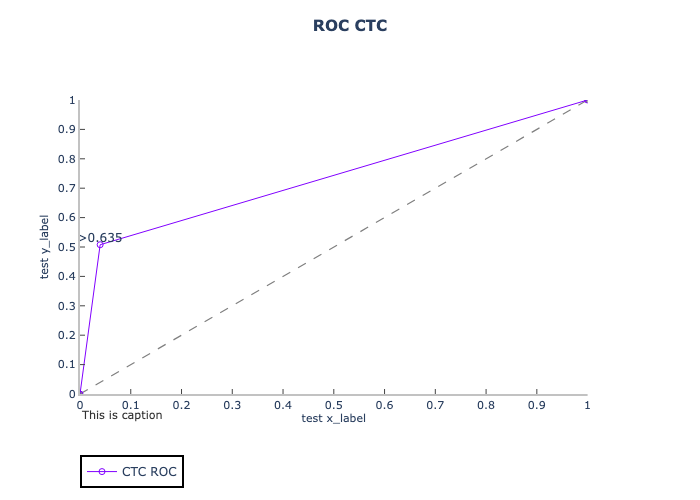
To generate the above plot, use the roc_diagram_defaults.yaml and the empty custom configuration file, minimal_roc_diagram.yaml. Then, perform the following:
verify that you are running in the conda environment that has the required Python packages outlined in the requirements section
cd to the $METPLOTPY_SOURCE/METplotpy/metplotpy/plots/roc_diagram directory
enter the following command:
python roc_diagram.py ./minimal_roc_diagram.yamla roc_diagram_default.png output file will be created in the $METPLOTPY_SOURCE/METplotpy/metplotpy/plots/roc_diagram directory. The filename is specified by the plot_filename value in the roc_diagram_defaults.yaml config file.
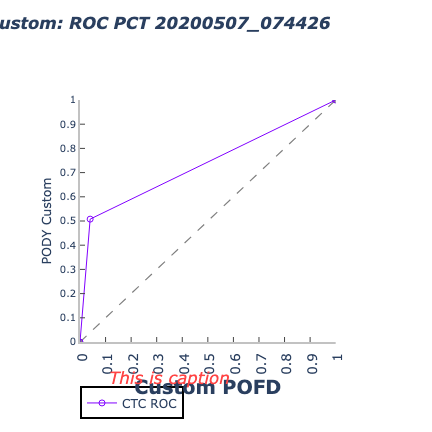
To generate a customized ROC diagram, use the custom_roc_diagram.yaml config file.
enter the following command:
python roc_diagram.py ./custom_roc_diagram.yaml
In this example, this custom config file changes the title and axis labels.
in addition, a .point1 (<outputfilename>.point1) text file is also generated, which lists the independent and dependent variables that are plotted. This information can be useful in debugging.