22. Skew-T Log-P Diagram
22.1. Description
A skew-T log-P plot (skew-T for short) is a thermodynamic diagram used for plotting upper air observations. This skew-T plotting capability was developed to read in and the plot the ASCII output of tropical cyclone diagnostic (TC-Diag) sounding data generated by a diagnostics code set developed by Colorado Institute for Research in the Atmosphere (CIRA). The TC-Diag data are currently derived along a projected or specified track of the center of a tropical cyclone and are meant to represent the thermodynamic environment that the storm will be in if it follows the given track. This TC-Diag code set is in the process of being incorporated into the METplus suite and will be available in an upcoming release. This chapter explains how to create skew-T plots from TC-Diag output using METplotpy’s Python-based plotter.
For more information on the skew-T log-P plot, please refer to the following:
22.2. Example
22.2.1. Sample Data
Sample data from CIRA are included with the source code. The data are ASCII text files in columnar format. The data are located in: $METPLOTPY_BASE/metplotpy/test/skew_t/data
where $METPLOTPY_BASE is the directory where the METplotpy code is saved.
e.g.,
/usr/path/to/METplotpy if the source code was cloned or forked from the Github repository
or
/usr/path/to/METplotpy-x.y.z if the source code was downloaded as a zip or gzip’d tar file from the Release link of the Github repository. The x.y.z is the release number.
For background information on the CIRA TC model diagnostics, please refer to:
McNoldy, B. D., K. D. Musgrave, and M. DeMaria, 2012: Diagnostics and verification of the tropical cyclone environment in regional models. AMS 30th Conference on Hurricanes and Tropical Meteorology, April 2012, Ponte Vedra Beach, Florida.
22.2.2. Configuration Files
The skew-T plotter utilizes a single YAML configuration file to indicate where input data is located and to set plot attributes. YAML is a recursive acronym for “YAML Ain’t Markup Language” and according to yaml.org, it is a “human-friendly data serialization language”. It is commonly used for configuration files and in applications where data is being stored or transmitted.
22.3. METplus Configuration
22.3.1. Required Configuration File
The plotter requires a mandatory configuration file, which is used to customize the settings to the skew-T plot. The skew_t.yaml file is included with the source code:
#
#  Settings for METplotpy skew-T diagram
#


# Input and output file information
input_directory: 'your/full/path/to/base/dir/of/input'
input_file_extension: '.dat'
output_directory: 'your/output/dir/to/save/plots'


# Log level: DEBUG, INFO, WARNING, ERROR.  NOTE: DEBUG is NOT recommended, only useful during development.
log_level: "INFO"
log_directory: 'your/directory/to/save/log/file'
log_filename: 'tc_diags_skewt.log'

# Sounding hours of interest. If all_sounding_hours is set to False, then the
# list of hours from sounding_hours_of_interest will be used.
all_sounding_hours: False

# Not used if all_sounding_hours is set to True
sounding_hours_of_interest: [ 0, 6 ]

# Turn on/off displaying features on the diagram
display_dry_adiabats: True
display_moist_adiabats: True
display_mixing_lines: True
display_windbarbs: True

# Control the density of windbarbs and levels (e.g. skip the nth value)
# Set to 1 if no decimation is to be performed.
decimate_barbs: 2

# Level labels along y2-axis (the right-side y-axis).
# If False, then labels will be along temperature curve).
level_labels_along_y2-axis: True

# figure size in inches
figure_size_width: 9
figure_size_height: 9

# Appearance of Temperature and dewpoint lines
# solid line '-', dashed line '--', dotted line ':'
# dashdot '-.'
temp_line_color: red
temp_line_style: '-'
temp_line_thickness: 2

dewpt_line_color: green
dewpt_line_style: '-'
dewpt_line_thickness: 2

# Set x-axis limits (temps) by position to "crop out" irrelevant areas.
set_x_axis_limits: False
x_axis_min: -50
x_axis_max: 50
To make configuration changes, first copy this config file from the directory where the source code was saved to your working directory:
cp $METPLOTPY_BASE/metplotpy/plots/skew_t/skew_t.yaml $WORKING_DIR/skew_t.yaml
- Modify the following settings in the configuration file:
input_directory Provide the full path to the directory where the sample data is located. Do not use environment variables.
output_directory Provide the full path to the directory where you wish to save the plots. Do not use environment variables.
log_directory Provide the full path to the directory where you wish to save the log file. Do not use environment variables.
The configuration file is configured to plot the pressure levels adjacent to the temperature line: level_labels_along_y2-axis: False
To plot the pressure levels along the y2-axis (right side of the plot), set this value to True: level_labels_along_y2-axis: True
The density of wind barbs has been reduced to plot every second wind barb by setting decimate_barbs: 2. If no decimation/thinning of wind barbs is required, set this value to 1.
To generate the skew-T plots for all available sounding hours, set all_sounding_hours:True
To generate plots for specific sounding hours, set all_sounding_hours:False and provide a list of all the hours of interest via the sounding_hours_of_interest setting: sounding_hours_of_interest: [6,18,30]. Replace these hours in the example with all the hours you wish to plot.
22.4. Running the Plotter from the Command Line
To generate a skew-T plot from the sample data and your skew_t.yaml configuration file, perform the following steps:
If using the conda environment, verify the conda environment is running and has the required Python packages outlined in the requirements section.
Set the METPLOTPY_BASE environment variable to point to $METPLOTPY_BASE
For the ksh environment:
export METPLOTPY_BASE=$METPLOTPY_BASE
For the csh environment:
setenv METPLOTPY_BASE $METPLOTPY_BASERecall that $METPLOTPY_BASE is the directory path indicating where the METplotpy source code was saved.
Enter the following command:
python $METPLOTPY_BASE/metplotpy/plots/skew_t/skew_t.py $WORKING_DIR/skew_t.yamlNumerous skew-T output files will be created in the directory that was specified in the output_directory configuration setting in skew_t.yaml. NOTE: The sample data contain some missing values for certain sample hours. Plots are only generated for those hours where there is data. A warning message is logged to the log file indicating which hour has missing data. When data are comprised entirely of missing data, then no corresponding plot will be generated. A warning message is logged to the log file indicating which file contains no data.
Output files are named with the same filename as the input file, with the .png extension replacing the .dat extension of the data file. The plot title is generated from the name of the input file and the corresponding sounding hour.
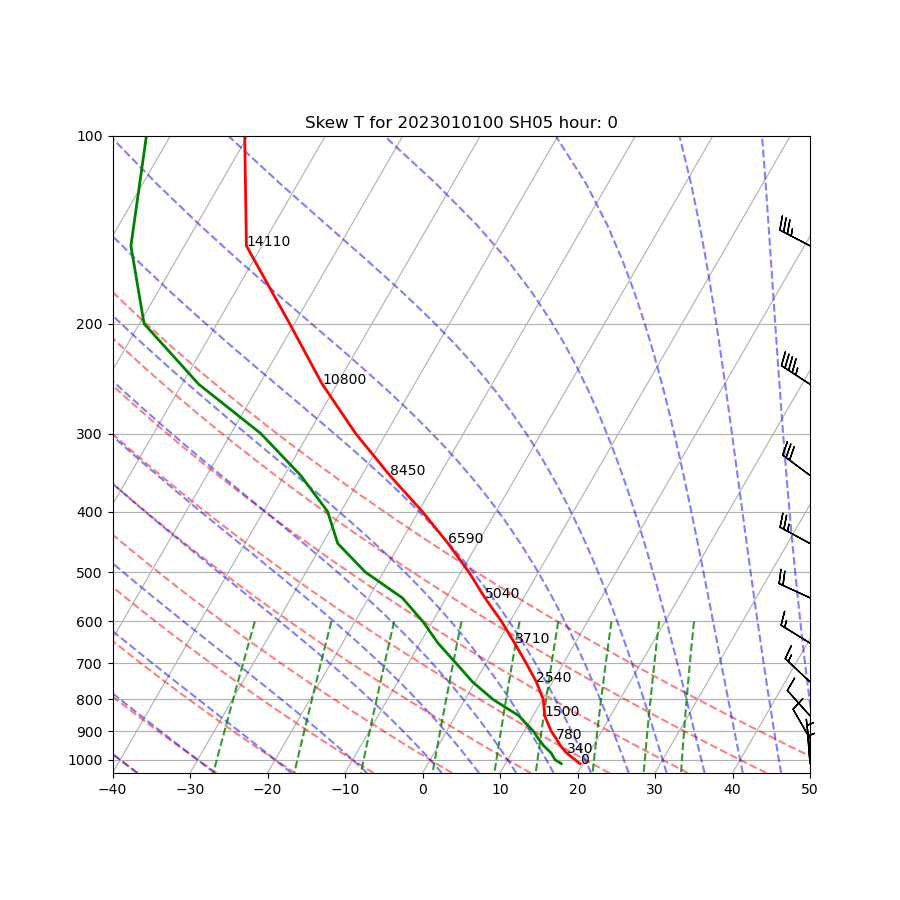
22.4.1. Example Output Plot
The skew_t.yaml configuration file in combination with the Python script and sample data, generates the following skew-T plot: