26. Wind Rose Diagram
26.1. Description
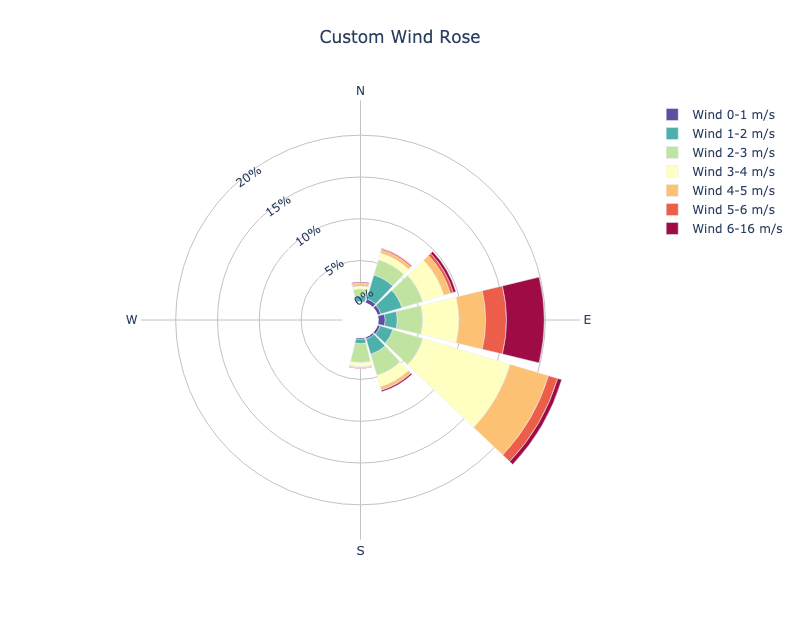
A wind rose diagram graphically displays the wind speed and wind direction at a particular location over a period of time. The diagram consists of radiating spokes that represent the wind direction in terms of the cardinal wind directions of North, East, South, and West. Each spoke indicates how often the wind blows from each direction and the color bands on each spoke represents the wind speed range (bins). The wind rose diagram is based on a polar coordinate system, with data plotted at a distance away from the origin at an angle that is relative to North.
26.2. Example
26.2.1. Sample Data
The data used to create a wind rose plot is columnar text output from MET for the MPR (matched pair) line type. The sample data used to create these plots is available in the METplotpy repository, where the wind rose diagram test scripts are located:
$METPLOTPY_BASE/test/wind rose_diagram/point_stat_mpr.txt
$METPLOTPY_BASE is the directory where the METplotpy code is saved:
$METPLOTPY_BASE is the directory where the METplotpy code is saved:
e.g.
/usr/path/to/METplotpy if the source code was cloned or forked from the Github repository
or
/usr/path/to/METplotpy-x.y.z if the source code was downloaded as a zip or gzip’d tar file from the Release link of the Github repository. The x.y.z is the release number.
26.2.2. Configuration Files
The wind rose diagram utilizes YAML configuration files to indicate where input data is located and to set plot attributes. These plot attributes correspond to values that can be set via the METviewer tool. YAML is a recursive acronym for “YAML Ain’t Markup Language” and according to yaml.org, it is a “human-friendly data serialization language. It is commonly used for configuration files and in applications where data is being stored or transmitted. Two configuration files are required. The first is a default configuration file, wind_rose_diagram_defaults.yaml, which is found in the $METPLOTPY_BASE/metplotpy/plots/config directory. $METPLOTPY_BASE indicates the directory where the METplotpy source code has been saved. All default configuration files are located in the $METPLOTPY_BASE/metplotpy/plots/config directory. Default configuration files are automatically loaded by the plotting code and do not need to be explicitly specified when generating a plot.
The second required configuration file is a user-supplied “custom” configuration file. This second configuration file is used to customize/override the default settings in the wind_rose_defaults.yaml file. The custom configuration file can be an empty file if all default settings are to be applied.
26.3. METplus Configuration
26.3.1. Default Configuration File
The following is the mandatory, wind_rose_defaults.yaml configuration file, which serves as a starting point for creating a wind rose diagram plot.
NOTE: This default configuration file is automatically loaded by wind_rose_diagram.py.
type: FCST
title: Wind Rose
log_filename: stdout
log_level: ERROR
wind_rose_breaks:
  - 0.0
  - 1.0
  - 2.0
  - 3.0
  - 4.0
  - 5.0
  - 6.0
wind_rose_angle: 30
wind_rose_marker_colors:
  - 'rgb(95,78,160)'
  - 'rgb(78,176,170)'
  - 'rgb(192,228,160)'
  - 'rgb(255,255,194)'
  - 'rgb(253,193,115)'
  - 'rgb(236,94,74)'
  - 'rgb(159,11,68)'
create_figure: True
show_legend: True
angularaxis_tickvals:
  - 0
  - 90
  - 180
  - 270
angularaxis_ticktext:
  - 'N'
  - 'E'
  - 'S'
  - 'W'
plot_filename: ./wind_rose_default.png
stat_input: ./point_stat_mpr.txt
plot_width: 800
plot_height: 620
dump_points: True
show_in_browser: False
In the default config file, logging is set to stdout and the log level is ERROR (i.e. only log messages of type ERROR will be logged). If the log_filename and log_level are not specified in the custom configuration file, these settings will be used.
26.3.2. Custom Configuration File
As previously mentioned, a second mandatory configuration file is required, which is used to customize the settings to the wind rose diagram plot. The wind_rose_custom.yaml file is included with the source code and looks like the following:
type: FCST
title: Wind Rose
wind_rose_breaks:
  - 0.0
  - 1.0
  - 2.0
  - 3.0
  - 4.0
  - 5.0
  - 6.0
wind_rose_angle: 30
wind_rose_marker_colors:
  - 'rgb(95,78,160)'
  - 'rgb(78,176,170)'
  - 'rgb(192,228,160)'
  - 'rgb(255,255,194)'
  - 'rgb(253,193,115)'
  - 'rgb(236,94,74)'
  - 'rgb(159,11,68)'
create_figure: True
show_legend: True
angularaxis_tickvals:
  - 0
  - 90
  - 180
  - 270
angularaxis_ticktext:
  - 'N'
  - 'E'
  - 'S'
  - 'W'

# !!!!!!!! IMPORTANT !!!!!!
# Uncomment the stat_input setting and specify the full path to the
# point_stat_mpr.txt file
stat_input: ./point_stat_mpr.txt

plot_filename: ./wind_rose_custom.png
dump_points: True

# Optional, uncomment and set to directory to store the .points1 file
# that is used by METviewer (created when dump_points_1 is set to True)
# if dump_points_1 is True and this is uncommented, the points1 file
# will be saved in the default location (i.e. where the input data file is stored).
# points_path: '/dir_to_save_points1_file'
show_in_browser: False

# To save your log output to a file, specify a path and filename and uncomment the line below.  Make sure you have
# permissions to the directory you specify.  The default, as specified in the default config file is stdout.
#log_filename: ./wind_rose.log

# To change the log level, specify a log level: debug, info, warning, error and uncomment the line below.
# The debug and info log levels will produce more log output.
#log_level: WARNING
Copy this custom config file from the directory where the source code was saved to the working directory:
cp $METPLOTPY_BASE/test/wind_rose/wind_rose_custom.yaml $WORKING_DIR/wind_rose_custom.yaml
Notice that this has many of the same settings found in the the wind_rose_default.yaml file. We will simply change the title of the custom plot to customize the plot. NOTE: You do not need to include all the configuration settings in your custom configuration file. You only need to include the settings you wish to override.
Modify the stat_input setting in the $METPLOTPY_BASE/test/wind_rose/wind_rose_custom.yaml file to explicitly point to the $METPLOTPY_BASE/test/wind_rose/wind_rose directory (where the custom config files and sample data reside). Replace the relative path ./point_stat_mpr.txt with the full path $METPLOTPY_BASE/test/wind_rose/point_stat_mpr.txt (including replacing $METPLOTPY_BASE with the full path to the METplotpy installation on the system). Modify the plot_filename setting to point to the output path where the plot will be saved, including the name of the plot. Modify the title from: title: Wind Rose to title: Custom Wind Rose Uncomment the entry (indicated by a ‘#’ symbol in front of it; remove the ‘#’ symbol to uncomment) for the stat_input setting to indicate where the input data is located and indicate the full path and name of the input data file.
For example:
stat_input: /username/myworkspace/METplotpy/test/wind_rose/point_stat_mpr.txt
plot_filename: /username/working_dir/output_plots/wind_rose_custom.png
title: Custom Wind Rose
This is where /username/myworkspace/METplotpy is $METPLOTPY_BASE and /username/working_dir is $WORKING_DIR. Make sure that the $WORKING_DIR directory that is specified exists and has the appropriate read and write permissions. The path listed for plot_filename may be changed to the output directory of one’s choosing. If this is not set, then the plot_filename setting specified in the $METPLOTPY_BASE/metplotpy/plots/config/wind_rose_defaults.yaml configuration file will be used.
To save the intermediate .points1 file (used by METviewer and useful for debugging), set the dump_points_1 setting to True. Uncomment or add (if it doesn’t exist) the points_path setting:
dump_points_1: ‘True’
points_path: ‘/dir_to_save_points1_file’
Replace the /dir_to_save_points1_file to the same directory where the .points1 file is saved. If points_path is commented out (indicated by a ‘#’ symbol in front of it), remove the ‘#’ symbol to uncomment the points_path so that it will be used by the code. Make sure that this directory exists and has the appropriate read and write permissions. NOTE: the points_path setting is optional and does not need to be defined in the configuration file unless saving the intermediate .points1 file is desired.
To save the log output to a file, uncomment the log_filename entry and specify the path and name of the log file. Select a directory with the appropriate read and write privileges. To modify the verbosity of logging than what is set in the default config file, uncomment the log_level entry and specify the log level (debug and info are higher verbosity, warning and error are lower verbosity).
26.3.3. Using Defaults
To use the default settings defined in the wind_rose_defaults.yaml file, specify a minimal custom configuration file (minimal_wind_rose_defaults.yaml), which consists of only a comment block, but it can be any empty file (write permissions for the output filename path corresponding to the plot_filename setting in the default configuration file will be needed. Otherwise, specify a plot_filename in the minimal_wind_rose.yaml file):
# minimal config file to use all the settings in the wind_rose_default.yaml file.
# **NOTE**: update the stat_input and plot_filename settings with the full path to your
# input file and output file, respectively.
stat_input: ./point_stat_mpr.txt
plot_filename: ./wind_rose_default.png

# Optional, uncomment and set to directory to store the .points1 file
# that is used by METviewer (created when dump_points_1 is set to True)
# if dump_points_1 is True and this is uncommented, the points1 file
# will be saved in the default location (i.e. where the input data file is stored).
#points_path: '/dir_to_save_points1_file'
Copy this file to the working directory:
cp $METPLOTPY_BASE/test/wind_rose/minimal_wind_rose.yaml $WORKING_DIR/minimal_wind_rose.yaml
Add the stat_input (input data) and plot_filename (output file/plot path) settings to the $WORKING_DIR/minimal_wind_rose.yaml file (anywhere below the comment block). The stat_input setting explicitly indicates where the sample data and custom configuration files are located. Set the stat_input to $METPLOTPY_BASE/test/wind_rose/point_stat_mpr.txt and set the plot_filename to $WORKING_DIR/output_plots/wind_rose_default.png:
stat_input: $METPLOTPY_BASE/test/wind_rose/point_stat_mpr.txt
plot_filename: $WORKING_DIR/output_plots/wind_rose_default.png
$WORKING_DIR is the working directory where all of the custom configuration files are being saved. NOTE: The plot_filename (output directory) may be specified to a directory other than the $WORKING_DIR/output_plots, as long as it is an existing directory where the author has read and write permissions.
To save the intermediate .points1 file (used by METviewer and useful for debugging), add the following lines to the minimal_wind_rose.yaml file (anywhere below the comment block):
dump_points_1: ‘True’
points_path: ‘/dir_to_save_points1_file’
Replace the /dir_to_save_points1_file to the same directory where the .points file is saved. Make sure that this directory exists and has the appropriate read and write permissions.
26.4. Run from the Command Line
To generate a default performance diagram (i.e. using settings in the wind_rose_defaults.yaml configuration file), perform the following:
If using the conda environment, verify the conda environment is running and has has the required Python packages outlined in the requirements section.
Set the METPLOTPY_BASE environment variable to point to $METPLOTPY_BASE.
For the ksh environment:
export METPLOTPY_BASE=$METPLOTPY_BASE
For the csh environment:
setenv METPLOTPY_BASE $METPLOTPY_BASEReplacing the $METPLOTPY_BASE with the directory where the METplotpy source code was saved.
Run the following on the command line:
python $METPLOTPY_BASE/metplotpy/plots/wind_rose/wind_rose.py $WORKING_DIR/minimal_wind_rose.yamlThis will create a PNG file, wind_rose_default.png, in the directory that was specified in the plot_filename setting of the minimal_wind_rose.yaml config file:

To generate the slightly modified, customized plot, re-run the above command using the wind_rose_custom.yaml file:
python $METPLOTPY_BASE/metplotpy/plots/wind_rose/wind_rose.py $WORKING_DIR/wind_rose_custom.yaml
A wind_rose_custom.png output file will be created in the directory that was specified in the plot_filename config setting in the custom_performance_diagram.yaml config file. The title will match what you set in the title setting of your custom_performance_diagram.yaml file.