8. Contour Plots
8.1. Description
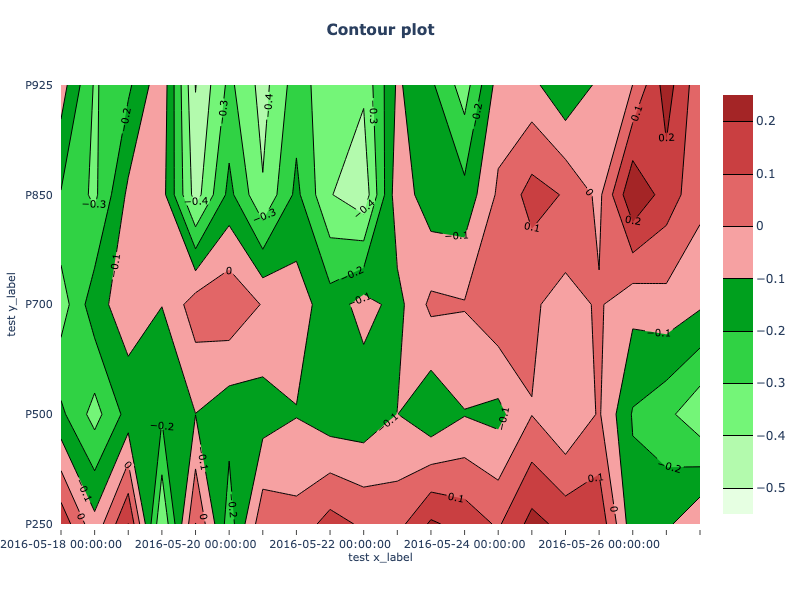
Contour plots are a very general plot type somewhat similar to a scatter plot. The axes are specified by the user, and any will do so long as the entire set of x and y locations has some value (i.e. not missing data). The value is then contoured. This type of plot is often used to examine statistics over a series of time or heights. For more information on Contour plots, please refer to the METviewer documentation.
8.2. Example
8.2.1. Sample Data
The data is text output from MET in columnar format. The sample data used to create these plots is available in the METplotpy repository:
$METPLOTPY_BASE/test/contour/contour.data
$METPLOTPY_BASE is the directory where the METplotpy code is saved:
e.g.
/usr/path/to/METplotpy if the source code was cloned or forked from the Github repository
or
/usr/path/to/METplotpy-x.y.z if the source code was downloaded as a zip or gzip’d tar file from the Release link of the Github repository. The x.y.z is the release number.
8.2.2. Configuration Files
The contour plot utilizes YAML configuration files to indicate where input data is located and to set plot attributes. These plot attributes correspond to values that can be set via the METviewer tool. YAML is a recursive acronym for “YAML Ain’t Markup Language” and according to yaml.org, it is a “human-friendly data serialization language. It is commonly used for configuration files and in applications where data is being stored or transmitted. Two configuration files are required. The first is a default configuration file, contour_defaults.yaml, which is found in the $METPLOTPY_BASE/metplotpy/plots/config directory. $METPLOTPY_BASE indicates the directory where the METplotpy source code has been saved. All default configuration files are located in the $METPLOTPY_BASE/metplotpy/plots/config directory. Default configuration files are automatically loaded by the plotting code and do not need to be explicitly specified when generating a plot.
The second required configuration file is a user-supplied “custom” configuration file. This file is used to customize/override the default settings in the contour_defaults.yaml file.
8.3. METplus Configuration
8.3.1. Default Configuration File
The following is the mandatory, contour_defaults.yaml configuration file, which serves as a starting point for creating a contour plot, as it represents the default values set in METviewer.
NOTE: This default configuration file is automatically loaded by contour.py.
add_color_bar: 'True'
add_contour_overlay: 'True'
alpha: 0.05

caption_align: 0.0
caption_col: '#333333'
caption_offset: 3.0
caption_size: 0.8
caption_weight: 1
cex: 1
circular_block_bootstrap: 'True'
cl_step: 0.05
color_palette: green_red
colors:
- '#000000'

contour_intervals: 10
create_html: 'False'
dump_points_1: 'False'
equalize_by_indep: 'False'
event_equal: 'False'
fcst_var_val_1: {}

indy_label: []
indy_vals: []

indy_var: ''
list_stat_1: []
legend_box: o
legend_inset:
  x: 0.0
  y: -0.25
legend_ncol: 3
legend_size: 0.8
line_type: None

log_filename: stdout
log_level: error
mar:
- 8.0
- 4.0
- 5.0
- 4.0
method: bca
mgp:
- 1.0
- 1.0
- 0.0
num_iterations: 1
num_threads: -1
plot_caption: ''

plot_disp:
- 'True'
plot_filename: /tmp/contour.png
plot_height: 8.5
plot_res: 72
plot_stat: median
plot_type: png16m
plot_units: in
plot_width: 11.0
random_seed: null
reverse_x: 'False'
reverse_y: 'False'
series_line_style:
- '-'
series_line_width:
- 1
series_order:
- 1

series_val_1: {}

stat_input: ../../../test/contour/contour.data
title: test title
title_align: 0.5
title_offset: -2
title_size: 1.4
title_weight: 2.0
user_legend: []

xaxis: test x_label
xlab_align: 0.5
xlab_offset: 2
xlab_size: 1
xlab_weight: 1
xlim: []
xtlab_decim: 0
xtlab_horiz: 0.5
xtlab_orient: 1
xtlab_perp: -0.75
xtlab_size: 1

yaxis_1: test y_label
ylab_align: 0.5
ylab_offset: -2
ylab_size: 1
ylab_weight: 1
ylim: []
ytlab_horiz: 0.5
ytlab_orient: 1
ytlab_perp: 0.5
ytlab_size: 1
In the default config file, logging is set to stdout and the log level is ERROR (i.e. only log messages of type ERROR will be logged). If the log_filename and log_level are not specified in the custom configuration file, these settings will be used.
8.3.2. Custom Configuration File
A second, mandatory configuration file is required, which is used to customize the settings to the contour plot. The custom_contour.yaml file is included with the source code and looks like the following:
add_color_bar: 'True'
add_contour_overlay: 'True'
alpha: 0.05

caption_align: 0.0
caption_col: '#333333'
caption_offset: 3.0
caption_size: 0.8
caption_weight: 1
cex: 1
circular_block_bootstrap: 'True'
cl_step: 0.05
color_palette: green_red
colors:
- '#000000'

contour_intervals: 10
create_html: 'False'
dump_points_1: 'False'
equalize_by_indep: 'False'
event_equal: 'False'
fcst_var_val_1:
  TMP:
  - ME

indy_label:
- '2016-05-18 00:00:00'
- '2016-05-18 12:00:00'
- '2016-05-19 00:00:00'
- '2016-05-19 12:00:00'
- '2016-05-20 00:00:00'
- '2016-05-20 12:00:00'
- '2016-05-21 00:00:00'
- '2016-05-21 12:00:00'
- '2016-05-22 00:00:00'
- '2016-05-22 12:00:00'
- '2016-05-23 00:00:00'
- '2016-05-23 12:00:00'
- '2016-05-24 00:00:00'
- '2016-05-24 12:00:00'
- '2016-05-25 00:00:00'
- '2016-05-25 12:00:00'
- '2016-05-26 00:00:00'
- '2016-05-26 12:00:00'
- '2016-05-27 00:00:00'
- '2016-05-27 12:00:00'
indy_vals:
- '2016-05-18 00:00:00'
- '2016-05-18 12:00:00'
- '2016-05-19 00:00:00'
- '2016-05-19 12:00:00'
- '2016-05-20 00:00:00'
- '2016-05-20 12:00:00'
- '2016-05-21 00:00:00'
- '2016-05-21 12:00:00'
- '2016-05-22 00:00:00'
- '2016-05-22 12:00:00'
- '2016-05-23 00:00:00'
- '2016-05-23 12:00:00'
- '2016-05-24 00:00:00'
- '2016-05-24 12:00:00'
- '2016-05-25 00:00:00'
- '2016-05-25 12:00:00'
- '2016-05-26 00:00:00'
- '2016-05-26 12:00:00'
- '2016-05-27 00:00:00'
- '2016-05-27 12:00:00'
indy_var: fcst_init_beg
legend_box: o
legend_inset:
  x: 0.0
  y: -0.25
legend_ncol: 3
legend_size: 0.8
line_type: None
list_stat_1:
- ME
mar:
- 8.0
- 4.0
- 5.0
- 4.0
method: bca
mgp:
- 1.0
- 1.0
- 0.0
num_iterations: 1
num_threads: -1
plot_caption: ''

plot_disp:
- 'True'
plot_height: 8.5
plot_res: 72
plot_stat: median
plot_type: png16m
plot_units: in
plot_width: 11.0
# Optional, uncomment and set to directory to store the .points1 file
# that is used by METviewer (created when dump_points_1 is set to True)
# if dump_points_1 is True and this is uncommented, the points1 file
# will be saved in the default location (i.e. where the input data file is stored).
#points_path: /dir_to_save_points1_file
random_seed: null
reverse_x: 'False'
reverse_y: 'False'
series_line_style:
- '-'
series_line_width:
- 1
series_order:
- 1

series_val_1:
  fcst_lev:
  - P250
  - P500
  - P700
  - P850
  - P925

title: Contour plot
title_align: 0.5
title_offset: -2
title_size: 1.4
title_weight: 2.0
user_legend: []

xaxis: test x_label
xlab_align: 0.5
xlab_offset: 2
xlab_size: 1
xlab_weight: 1
xlim: []
xtlab_decim: 0
xtlab_horiz: 0.5
xtlab_orient: 1
xtlab_perp: -0.75
xtlab_size: 1

yaxis_1: test y_label
ylab_align: 0.5
ylab_offset: -2
ylab_size: 1
ylab_weight: 1
ylim: []
ytlab_horiz: 0.5
ytlab_orient: 1
ytlab_perp: 0.5
ytlab_size: 1

stat_input: ./contour.data
plot_filename: ./contour.png

# To save your log output to a file, specify a path and filename and uncomment the line below.  Make sure you have
# permissions to the directory you specify.  The default, as specified in the default config file is stdout.
#log_filename: ./contour.log

# To change the log level, specify a log level: debug, info, warning, error and uncomment the line below.
#  Debug and info log level will produce more log output.
#log_level: WARNING
Copy this custom config file from the directory where the source code was saved to the working directory:
cp $METPLOTPY_BASE/test/contour/custom_contour.yaml $WORKING_DIR/custom_contour.yaml
Modify the stat_input setting in the $METPLOTPY_BASE/test/contour/custom_contour.yaml file to explicitly point to the $METPLOTPY_BASE/test/contour directory (where the custom config files and sample data reside). Replace the relative path ./contour.data with the full path $METPLOTPY_BASE/test/contour/contour.data (including replacing $METPLOTPY_BASE with the full path to the METplotpy installation on the system). Modify the plot_filename setting to point to the output path where the plot will be saved, including the name of the plot.
For example:
stat_input: /username/myworkspace/METplotpy/test/contour/contour.data
plot_filename: /username/working_dir/output_plots/contour_custom.png
This is where /username/myworkspace/METplotpy is $METPLOTPY_BASE and /username/working_dir is $WORKING_DIR. Make sure that the $WORKING_DIR directory that is specified exists and has the appropriate read and write permissions. The path listed for plot_filename may be changed to the output directory of one’s choosing. If this is not set, then the plot_filename setting specified in the $METPLOTPY_BASE/metplotpy/plots/config/contour_defaults.yaml configuration file will be used.
To save the intermediate .points1 file (used by METviewer and useful for debugging), set the dump_points_1 setting to True. Uncomment or add (if it doesn’t exist) the points_path setting:
dump_points_1: ‘True’
points_path: ‘/dir_to_save_points1_file’
Replace the /dir_to_save_points1_file to the same directory where the .points1 file is saved. If points_path is commented out (indicated by a ‘#’ symbol in front of it), remove the ‘#’ symbol to uncomment the points_path so that it will be used by the code. Make sure that this directory exists and has the appropriate read and write permissions. NOTE: the points_path setting is optional and does not need to be defined in the configuration file unless saving the intermediate .points1 file is desired.
To save the log output to a file, uncomment the log_filename entry and specify the path and name of the log file. Select a directory with the appropriate read and write privileges. To modify the verbosity of logging than what is set in the default config file, uncomment the log_level entry and specify the log level (debug and info are higher verbosity, warning and error are lower verbosity).
8.4. Run from the Command Line
To generate a contour plot (i.e. using settings in the custom_contour.yaml configuration file), perform the following:
If using the conda environment, verify the conda environment is running and has has the required Python packages outlined in the requirements section.
Set the METPLOTPY_BASE environment variable to point to $METPLOTPY_BASE.
For the ksh environment:
export METPLOTPY_BASE=$METPLOTPY_BASE
For the csh environment:
setenv METPLOTPY_BASE $METPLOTPY_BASERecall that $METPLOTPY_BASE is the directory path indicating where the METplotpy source code was saved.
Run the following on the command line:
python $METPLOTPY_BASE/metplotpy/plots/contour/contour.py $WORKING_DIR/custom_contour.yamlThis will create a PNG file, contour.png, in the directory that was specified in the plot_filename setting of the custom_contour.yaml config file:
A contour.png output file will be created in the directory that was specified in the plot_filename config setting in the custom_contour.yaml config file.