25. Polar Ice Plot
25.1. Description
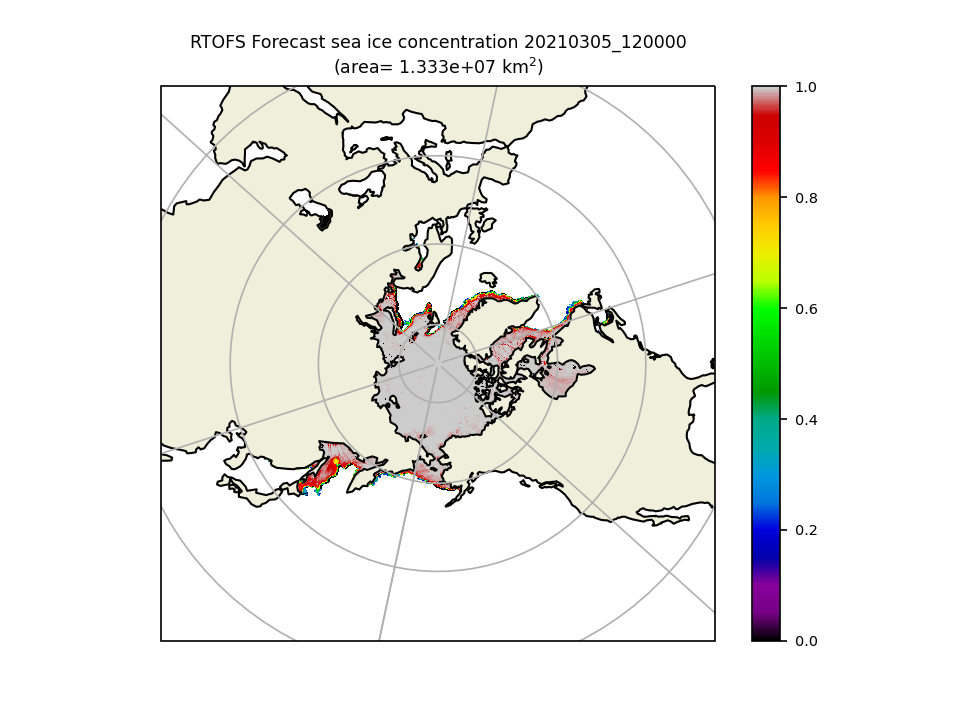
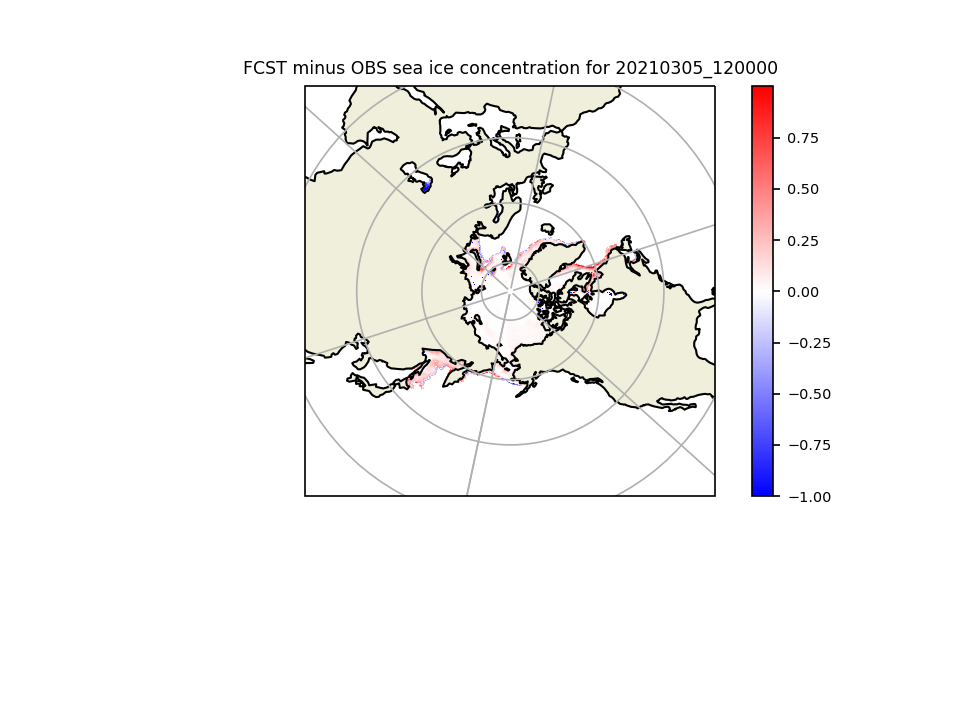
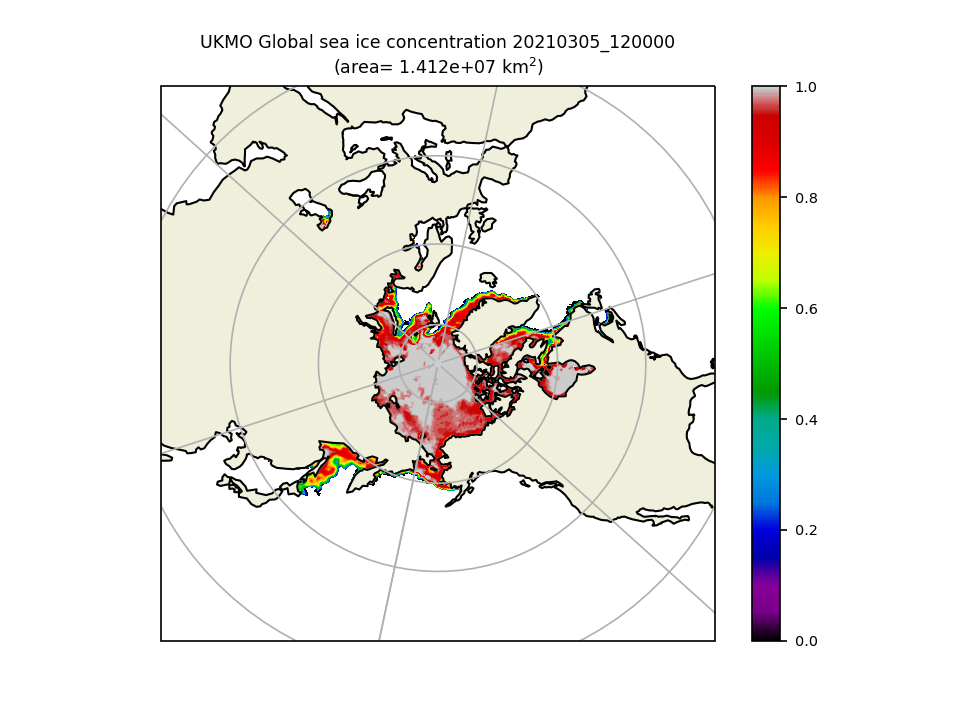
A Polar Ice plot is a 2D plot using a polar stereographic projection. There is a specific example found in the polar_ice_plot which plots sea ice area averages
To generate the polar_ice_plot edit the polar_ice.yaml and have your input file point to either the example or one of your choosing and then run python polar_ice_plot.py
25.2. Required Packages:
metplotpy
netcdf4 1.5.6
numpy 1.20.2
pandas 1.2.3
scipy 1.5.3
xarray 0.16.0
cartopy 0.18.0
matplotlib 3.3.0
pyproj 2.4.2
pyresample 2.1.3
pillow 8.3.1
25.3. Example
25.3.1. Sample Data
The sample data used to create an example Polar Ice plot is available in the marine_coastal file grid_stat_north_000000L_20210305_120000V_pairs.nc.
Save this file in a directory where you have read and write permissions, such as $WORKING_DIR/data/polar_plot, where $WORKING_DIR is the path to your data directory.
25.3.2. Configuration Files
There is a YAML config file located in $METPLOTPY_BASE/metplotpy/plots/polar_plot/polar_ice.yaml
$METPLOTPY_BASE is the directory where the METplotpy code is saved:
e.g.
/usr/path/to/METplotpy if the source code was cloned or forked from the Github repository
or
/usr/path/to/METplotpy-x.y.z if the source code was downloaded as a zip or gzip’d tar file from the Release link of the Github repository. The x.y.z is the release number.
Copy this configuration file from where you saved the METplotpy source code to your working directory:
cp $METPLOTPY_BASE/metplotpy/plots/polar_plot/polar_ice.yaml $WORKING_DIR/polar_ice.yaml
$METPLOTPY_BASE is the directory where you saved the METplotpy code, and $WORKING_DIR is the directory where you have read and write permissions.
Modify input_file setting in the $WORKING_DIR/polar_ice.yaml config file to point to the directory where you saved your sample data from above:
e.g.
replace input_file: “~/grid_stat_north_000000L_20210305_120000V_pairs.nc” with input_file: “/path/to/data/grid_stat_north_000000L_20210305_120000V_pairs.nc”
Where “/path/to/data” is the full path to the directory where you saved the grid_stat_north_000000L_20210305_120000V_pairs.nc sample data.
25.4. Run from the Command Line
To generate the example Polar Ice plot (i.e. using settings in the polar_ice.yaml configuration file) perform the following:
If using the conda environment, verify the conda environment is running and has has the required Python packages specified in the Required Packages section above.
Set the METPLOTPY_BASE environment variable to point to $METPLOTPY_BASE. where $METPLOTPY_BASE is the directory where you saved the METplotpy source code (e.g. /home/someuser).
For the ksh environment:
export METPLOTPY_BASE=$METPLOTPY_BASE
For the csh environment:
setenv METPLOTPY_BASE $METPLOTPY_BASERun the following on the command line (from your $WORKING_DIR):
cd $WORKING_DIR
python $METPLOTPY_BASE/metplotpy/plots/polar_plot/polar_ice_plot.py
where $METPLOTPY_BASE is the directory where you are storing the METplotpy source code and $WORKING_DIR is the directory where you have read and write permissions and where you are storing all your input data and where you copied the config file. The polar_ice_plot.py script looks for the polar_ice.yaml file in the current working directory.
Three plots named 20210305_120000_fcst_ice_north.png 20210305_120000_ice_diff_north.png 20210305_120000_observation_ice_north.png will be generated in the sub directory ice_plots from where you ran the above command: