10. Reliability Diagram
10.1. Description
Reliability diagrams are useful in displaying the conditional bias of probabilistic forecasts. For more information about reliability diagrams, refer to the METviewer documentation.
10.2. Example
10.2.1. Sample Data
The data is text output from MET in columnar format. The sample data used to create an example reliability diagram is available in the METplotpy repository, where the reliability diagram code is located:
$METPLOTPY_BASE/metplotpy/test/reliability_diagram/plot_20210311_145053.data
$METPLOTPY_BASE is the directory where the METplotpy code is saved:
e.g.
/usr/path/to/METplotpy if the source code was cloned or forked from the Github repository
or
/usr/path/to/METplotpy-x.y.z if the source code was downloaded as a zip or gzip’d tar file from the Release link of the Github repository. The x.y.z is the release number.
10.2.2. Configuration Files
The reliability diagram utilizes YAML configuration files to indicate where input data is located and to set plot attributes. These plot attributes correspond to values that can be set via the METviewer tool. YAML is a recursive acronym for “YAML Ain’t Markup Language” and according to yaml.org, it is a “human-friendly data serialization language”. It is commonly used for configuration files and in applications where data is being stored or transmitted. Two configuration files are required. The first is a default configuration file, reliability_defaults.yaml, which is found in the $METPLOTPY_BASE/metplotpy/plots/config directory. All default configuration files are located in the $METPLOTPY_BASE/metplotpy/plots/config directory. Note: $METPLOTPY_BASE is the user-specified directory where the METplotpy source code has been saved. Default configuration files are automatically loaded by the plotting code and do not need to be explicitly specified when generating a plot
The second required configuration file is a user-supplied “custom” configuration file. This file is used to customize/override the default settings in the reliability_defaults.yaml file. The custom configuration file can be an empty file if all default settings are to be applied.
10.3. METplotpy Configuration
10.3.1. Default Configuration File
The following is the mandatory, reliability_defaults.yaml configuration file, which serves as a starting point for creating a reliability diagram plot as it represents the default values set in METviewer.
NOTE: This default configuration file is automatically loaded by reliability_diagram.py.
add_noskill_line: 'True'
add_reference_line: 'True'
add_skill_line: 'True'
alpha: 0.05
box_avg: 'False'
box_boxwex: 0.2
box_notch: 'False'
box_outline: 'True'
box_pts: 'False'
caption_align: 0.0
caption_col: '#333333'
caption_offset: 3.0
caption_size: 0.8
caption_weight: 1
cex: 1
circular_block_bootstrap: 'True'
colors:
- '#ff0000'
con_series:
- 1
create_html: 'True'
derived_series_1: []
derived_series_2: []
dump_points_1: 'False'
dump_points_2: 'False'
event_equal: 'False'
fcst_var_val_1:
  PROB(APCP_03>1.270):
  - PSTD_CALIBRATION
  - PSTD_BASER
  - PSTD_NI
fcst_var_val_2: null
fixed_vars_vals_input: {}
grid_col: '#cccccc'
grid_lty: 3
grid_lwd: 1
grid_on: 'True'
grid_x: listX
indy_label: []
indy_stagger_1: 'False'
indy_stagger_2: 'False'
indy_vals:
- '0'
- '0.1'
- '0.2'
- '0.3'
- '0.4'
- '0.5'
- '0.6'
- '0.7'
- '0.8'
- '0.9'
indy_var: thresh_i
inset_hist: 'True'
legend_box: o
legend_inset:
  x: 0.0
  y: -0.25
legend_ncol: 3
legend_size: 0.8
line_type: pct
list_stat_1:
- PSTD_CALIBRATION
- PSTD_BASER
- PSTD_NI
list_stat_2: []
mar:
- 8
- 4
- 5
- 4
method: perc
mgp:
- 1
- 1
- 0
num_iterations: 1
num_threads: -1
plot_caption: ''
plot_ci:
- none
plot_disp:
- 'True'
plot_filename: ./default_reliability_diagram.png
plot_height: 8.5
plot_res: 72
plot_stat: median
plot_type: png16m
plot_units: in
plot_width: 11.0
random_seed: null
rely_event_hist: 'True'
series_line_style:
- '-'
series_line_width:
- 1
series_order:
- 1
series_symbols:
- .
series_type:
- b
series_val_1: {}
series_val_2: {}
show_nstats: 'False'
show_signif:
- 'False'
stat_input: ./plot_20210311_145053.data
summary_curves: []
sync_yaxes: 'False'
title: test title
title_align: 0.5
title_offset: -2
title_size: 1.4
title_weight: 2.0
user_legend: []
variance_inflation_factor: 'True'
vert_plot: 'False'
x2lab_align: 0.5
x2lab_offset: -0.5
x2lab_size: 0.8
x2lab_weight: 1
x2tlab_horiz: 0.5
x2tlab_orient: 1
x2tlab_perp: 1
x2tlab_size: 0.8
xaxis: test x_label
xaxis_reverse: 'False'
xlab_align: 0.5
xlab_offset: 2
xlab_size: 1
xlab_weight: 1
xlim: []
xtlab_decim: 0
xtlab_horiz: 0.5
xtlab_orient: 1
xtlab_perp: -0.75
xtlab_size: 1
y2lab_align: 0.5
y2lab_offset: 1
y2lab_size: 1
y2lab_weight: 1
y2lim: []
y2tlab_horiz: 0.5
y2tlab_orient: 1
y2tlab_perp: 1
y2tlab_size: 1.0
yaxis_1: test y_label
yaxis_2: ''
ylab_align: 0.5
ylab_offset: -2
ylab_size: 1
ylab_weight: 1
ylim: []
ytlab_horiz: 0.5
ytlab_orient: 1
ytlab_perp: 0.5
ytlab_size: 1
10.3.2. Custom Configuration File
A second, mandatory configuration file is required, which is used to customize the settings to the reliability diagram plot. The custom_reliability.yaml file is included with the source code an looks like the following:
add_noskill_line: 'True'
add_reference_line: 'True'
add_skill_line: 'True'
alpha: 0.05
box_avg: 'False'
box_boxwex: 0.2
box_notch: 'False'
box_outline: 'True'
box_pts: 'False'
caption_align: 0.0
caption_col: '#333333'
caption_offset: 3.0
caption_size: 0.8
caption_weight: 1
cex: 1
circular_block_bootstrap: 'True'
colors:
- 'blue'
con_series:
- 1
create_html: 'True'
derived_series_1: []
derived_series_2: []
dump_points_1: 'False'
dump_points_2: 'False'
event_equal: 'False'
fcst_var_val_1:
  PROB(APCP_03>1.270):
  - PSTD_CALIBRATION
  - PSTD_BASER
  - PSTD_NI
fcst_var_val_2: null
fixed_vars_vals_input: {}
grid_col: '#cccccc'
grid_lty: 3
grid_lwd: 1
grid_on: 'True'
grid_x: listX
indy_label: []
indy_stagger_1: 'False'
indy_stagger_2: 'False'
indy_vals:
- '0'
- '0.1'
- '0.2'
- '0.3'
- '0.4'
- '0.5'
- '0.6'
- '0.7'
- '0.8'
- '0.9'
indy_var: thresh_i
inset_hist: 'True'
legend_box: o
legend_inset:
  x: 0.0
  y: -0.25
legend_ncol: 3
legend_size: 0.8
line_type: pct
list_stat_1:
- PSTD_CALIBRATION
- PSTD_BASER
- PSTD_NI
list_stat_2: []
mar:
- 8
- 4
- 5
- 4
method: perc
mgp:
- 1
- 1
- 0
num_iterations: 1
num_threads: -1
plot_caption: ''
plot_ci:
- none
plot_disp:
- 'True'
plot_filename: ./custom_reliability_diagram.png
plot_height: 8.5
plot_res: 72
plot_stat: median
plot_type: png16m
plot_units: in
plot_width: 11.0

# Optional, uncomment and set to directory to store the .points1 file
# that is used by METviewer (created when dump_points_1 is set to True)
# if dump_points_1 is True and this is uncommented, the points1 file
# will be saved in the default location (i.e. where the input data file is stored).
#points_path: /dir_to_save_points1_file
random_seed: null
rely_event_hist: 'True'
series_line_style:
- '-'
series_line_width:
- 1
series_order:
- 1
series_symbols:
- .
series_type:
- b
series_val_1: {}
series_val_2: {}
show_nstats: 'False'
show_signif:
- 'False'
stat_input: ./plot_20210311_145053.data
summary_curves: []
sync_yaxes: 'False'
title: test title
title_align: 0.5
title_offset: -2
title_size: 1.4
title_weight: 2.0
user_legend: []
variance_inflation_factor: 'True'
vert_plot: 'False'
x2lab_align: 0.5
x2lab_offset: -0.5
x2lab_size: 0.8
x2lab_weight: 1
x2tlab_horiz: 0.5
x2tlab_orient: 1
x2tlab_perp: 1
x2tlab_size: 0.8
xaxis: test x_label
xaxis_reverse: 'False'
xlab_align: 0.5
xlab_offset: 2
xlab_size: 1
xlab_weight: 1
xlim: []
xtlab_decim: 0
xtlab_horiz: 0.5
xtlab_orient: 1
xtlab_perp: -0.75
xtlab_size: 1
y2lab_align: 0.5
y2lab_offset: 1
y2lab_size: 1
y2lab_weight: 1
y2lim: []
y2tlab_horiz: 0.5
y2tlab_orient: 1
y2tlab_perp: 1
y2tlab_size: 1.0
yaxis_1: test y_label
yaxis_2: ''
ylab_align: 0.5
ylab_offset: -2
ylab_size: 1
ylab_weight: 1
ylim: []
ytlab_horiz: 0.5
ytlab_orient: 1
ytlab_perp: 0.5
ytlab_size: 1
Copy this custom config file from the directory where the source code was saved to the working directory:
cp $METPLOTPY_BASE/test/reliability_diagram/custom_reliability_diagram.yaml $WORKING_DIR/custom_reliability_diagram.yaml
Modify the stat_input setting in the $METPLOTPY_BASE/test/reliability_diagram/custom_reliability_diagram.yaml file to explicitly point to the $METPLOTPY_BASE/test/reliability_diagram/reliability_diagram directory (where the custom config files and sample data reside). Replace the relative path ./plot_20210311_145053.data with the full path $WORKING_DIR/METplotpy/test/reliability_diagram/plot_20210311_145053.data (including replacing $METPLOTPY_BASE with the full path to the METplotpy installation on the system). Modify the plot_filename setting to point to the output path where the plot will be saved, including the name of the plot.
For example:
stat_input: /username/myworkspace/METplotpy/test/reliability_diagram/plot_20210311_145053.data
plot_filename: /username/working_dir/output_plots/reliability_diagram_custom.png
This is where /username/myworkspace/METplotpy is $METPLOTPY_BASE and /username/working_dir is $WORKING_DIR. Make sure that the $WORKING_DIR directory that is specified exists and has the appropriate read and write permissions. The path listed for plot_filename may be changed to the output directory of one’s choosing. If this is not set, then the plot_filename setting specified in the $METPLOTPY_BASE/metplotpy/plots/config/reliability_diagram_defaults.yaml configuration file will be used.
To save the intermediate .points1 file (used by METviewer and useful for debugging), set the dump_points_1 setting to True. Uncomment or add (if it doesn’t exist) the points_path setting:
dump_points_1: ‘True’
points_path: ‘/dir_to_save_points1_file’
Replace the /dir_to_save_points1_file to the directory where the .points1 file is saved. If points_path is commented out (indicated by a ‘#’ symbol in front of it), remove the ‘#’ symbol to uncomment the points_path so that it will be used by the code. Make sure that this directory exists and has the appropriate read and write permissions. NOTE: The points_path setting is optional and does not need to be defined in the configuration file unless saving the intermediate .points1 file is desired.
10.3.3. Using Defaults
If the user wishes to use all the default settings defined in the reliability_defaults.yaml file, an empty custom configuration file (custom_reliability_use_defaults.yaml) can be specified (as long as the user has write permissions for the output filename path corresponding to the plot_filename setting in the default configuration file. Otherwise, this will need to be specified in plot_filename in the minimal_box.yaml file):
add_noskill_line: 'True'
add_reference_line: 'True'
add_skill_line: 'True'
alpha: 0.05
box_avg: 'False'
box_boxwex: 0.2
box_notch: 'False'
box_outline: 'True'
box_pts: 'False'
caption_align: 0.0
caption_col: '#ff1493'
caption_offset: 3.0
caption_size: 1.0
caption_weight: 1
cex: 1
colors:
- '#ff0000'
- '#00ff7f'
- '#8000ff'
con_series:
- 1
- 1
- 1
create_html: 'False'
derived_series_1: []
derived_series_2: []
dump_points_1: 'True'
dump_points_2: 'False'
event_equal: 'True'
fcst_var_val_1:
  APCP_03_ENS_FREQ_ge12.7:
  - PSTD_CALIBRATION
  - PSTD_BASER
  - PSTD_NI
fcst_var_val_2: null
fixed_vars_vals_input: {}
grid_col: '#cccccc'
grid_lty: 3
grid_lwd: 1
grid_on: 'True'
grid_x: listX
indy_label: []
indy_stagger_1: 'True'
indy_stagger_2: 'False'
indy_vals:
- '0'
- '0.1'
- '0.2'
- '0.3'
- '0.4'
- '0.5'
- '0.6'
- '0.7'
- '0.8'
- '0.9'
indy_var: thresh_i
inset_hist: 'True'
legend_box: o
legend_inset:
  x: 0.0
  y: -0.25
legend_ncol: 3
legend_size: 0.8
line_type: pct
list_stat_1:
- PSTD_CALIBRATION
- PSTD_BASER
- PSTD_NI
list_stat_2: []
list_static_val:
  fcst_var: APCP_03_ENS_FREQ_ge12.7
mar:
- 8
- 4
- 5
- 4
method: perc
mgp:
- 1
- 1
- 0
num_iterations: 1000
num_threads: -1
plot_caption: capcap uuu
plot_ci:
- boot
- boot
- none
plot_disp:
- 'True'
- 'True'
- 'True'
plot_height: 8.5
plot_res: 72
plot_stat: median
plot_type: png16m
plot_units: in
plot_width: 11.0
random_seed: null
rely_event_hist: 'True'
series_line_style:
- '-'
- '-'
- '-'
series_line_width:
- 1
- 1
- 1
series_order:
- 1
- 2
- 3
series_symbols:
- .
- .
- .
series_type:
- b
- b
- b
series_val_1:
  model:
  - rap0_3_spptens
  - rap0_7_spptens
series_val_2: {}
show_nstats: 'False'
show_signif:
- 'False'
- 'False'
- 'False'
summary_curves:
- mean
sync_yaxes: 'False'
title: The <br> test
title_align: 0.5
title_offset: -2
title_size: 1.6
title_weight: 4.0
user_legend: []
variance_inflation_factor: 'False'
vert_plot: 'False'
x2lab_align: 0.5
x2lab_offset: -0.5
x2lab_size: 0.8
x2lab_weight: 1
x2tlab_horiz: 0.5
x2tlab_orient: 1
x2tlab_perp: 1
x2tlab_size: 0.8
xaxis: some x
xaxis_reverse: 'False'
xlab_align: 0.5
xlab_offset: 2
xlab_size: 1
xlab_weight: 2
xlim: []
xtlab_decim: 0
xtlab_horiz: 0.5
xtlab_orient: 1
xtlab_perp: -0.75
xtlab_size: 1
y2lab_align: 0.5
y2lab_offset: 1
y2lab_size: 1
y2lab_weight: 1
y2lim: []
y2tlab_horiz: 0.5
y2tlab_orient: 1
y2tlab_perp: 1
y2tlab_size: 1.0
yaxis_1: some y
yaxis_2: ''
ylab_align: 0.5
ylab_offset: -2
ylab_size: 2
ylab_weight: 3
ylim: []
ytlab_horiz: 0.5
ytlab_orient: 1
ytlab_perp: 0.5
ytlab_size: 1
plot_filename: ./reliability.png
stat_input: ./reliability.data
Copy this file to the working directory:
cp $METPLOTPY_BASE/test/reliability_diagram/minimal_reliability_diagram.yaml $WORKING_DIR/minimal_reliability_diagram.yaml
Add the stat_input (input data) and plot_filename (output file/plot) settings to the $WORKING_DIR/minimal_reliability_diagram.yaml file (anywhere below the comment block). The stat_input setting explicitly indicates where the sample data and custom configuration files are located.
Set the stat_input to $METPLOTPY_BASE/test/reliability_diagram/plot_20210311_145053.data and set the plot_filename to $WORKING_DIR/output_plots/reliability_diagram_default.png:
stat_input: $METPLOTPY_BASE/test/reliability_diagram/plot_20210311_145053.data
plot_filename: $WORKING_DIR/output_plots/reliability_diagram_default.png
$WORKING_DIR is the working directory where all the custom configuration files are saved. NOTE: To specify the plot_filename (output directory) to a directory other than the $WORKING_DIR/output_plots, this can be done as long as it is an existing directory where the user has read and write permissions.
To save the intermediate .points1 file (used by METviewer and useful for debugging), add the following lines to the minimal_reliability_diagram.yaml file (anywhere below the comment block):
dump_points_1: ‘True’
points_path: ‘/dir_to_save_points1_file’
Replace the /dir_to_save_points1_file to the same directory where the .points1 file is located. Make sure that this directory exists and has the appropriate read and write permissions. NOTE: the points_path setting is optional and does not need to be defined in the configuration file unless saving it to the intermediate .points1 file is desired.
10.4. Run from the Command Line
The reliability diagram plot that uses only the default values defined in the reliability_defaults.yaml configuration file looks like the following:
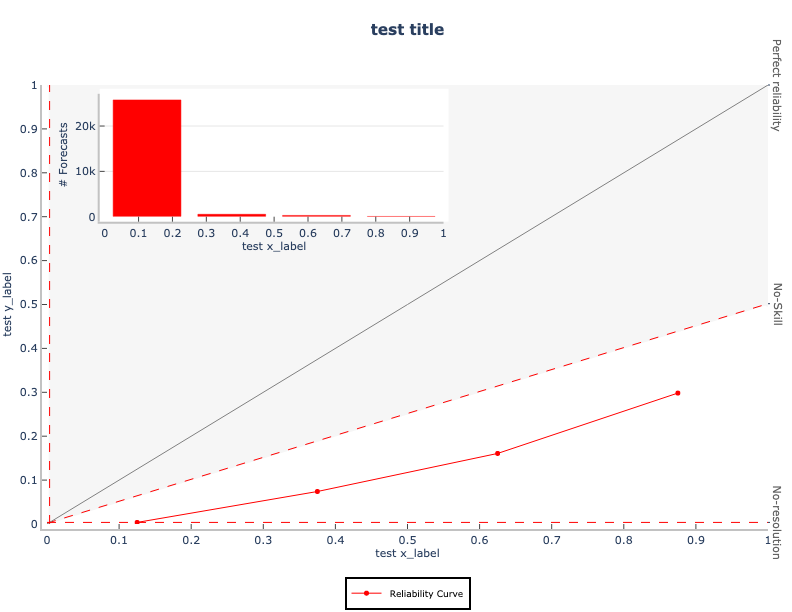
To generate the above plot, use the reliability_defaults.yaml file, the “empty” custom configuration file and the custom_reliability_use_defaults.yaml config file.
Perform the following:
Clone the code from the METplotpy repository (To see the page, login to Github):
cd $METPLOTPY_BASE
git clone https://github.com/dtcenter/METplotpy
If using the conda environment, verify the conda environment is running and has has the required Python packages outlined in the requirements section.
Set the METPLOTPY_BASE environment variable to point to $METPLOTPY_BASE.
For the ksh environment:
export METPLOTPY_BASE=$METPLOTPY_BASE
For the csh environment:
setenv METPLOTPY_BASE $METPLOTPY_BASEReplacing the $METPLOTPY_BASE with the directory where the METplotpy source code was saved.
Enter the following command:
python $METPLOTPY_BASE/metplotpy/plots/reliability_diagram/reliability.py $WORKING_DIR/custom_reliability_use_defaults.yamlA default_reliability_diagram.png output file will be created in the directory specified in the plot_filename configuration setting in the minimal_reliability.yaml config file. The filename is specified by the plot_filename value in the reliability_defaults.yaml config file.
To generate a customized reliability diagram (i.e. some or all default configuration settings are to be overridden), use the custom_reliability_diagram.yaml config file.
Enter the following command:
python $METPLOTPY_BASE/metplotpy/plots/reliability_diagram/reliability.py $WORKING_DIR/custom_reliability_diagram.yamlIn this example, this custom config file changes the color of the boxes.
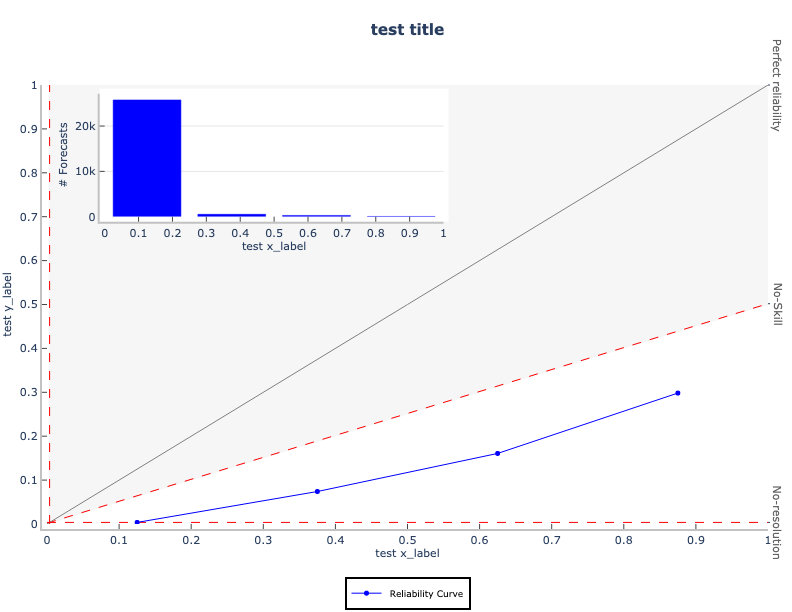
A custom_reliability_diagram.png output file will be created in the directory specified in the plot_filename configuration setting in the custom_reliability_diagram.yaml config file.