25. FV3 physics tendencies
25.1. Description
Plot tendencies of temperature, moisture, and wind components averaged over a time window and spatial domain. Tendencies are partitioned into physics parameterizations and dynamics. Physics parameterizations include schemes like deep convection, convective gravity wave drag, short wave radiation, planetary boundary layer, microphysics, and others listed below. Non-physics tendencies (or dynamics) are due to horizontal and vertical motion. The residual (which should be zero) is the difference between the actual change in the state variable over the requested time window and the expected change due to physics parameterizations and dynamics tendencies. One can plot a single tendency component at multiple pressure levels or plot all tendency components at a single pressure level. Plan views (horizontal cross sections), vertical profiles, and difference plots are also available.
25.2. Required Packages:
cartopy (0.20.3 only)
matplotlib
metpy
numpy
pandas
shapely
xarray
25.3. Required input:
FV3 3-D history file with physics and dynamics tendencies (fv3_history.nc)
FV3 2-D grid specification file with latititude and longitude of each grid point (grid_spec.nc)
Download the fv3_history.nc and grid_spec.nc files
Save this file in a directory where you have read and write permissions, such as $WORKING_DIR/data/fv3_physics_tend, where $WORKING_DIR is the path to the directory where you will save input data.
For additional details see grid description in UFS Short Range Weather App user manual
25.3.1. Available tendency variables
A small description of each tendency variable and their nicknames are shown below. Some tendencies do not apply to all four state variables, so these cells are blank.
tendency |
temperature |
specific humidity |
u-wind |
v-wind |
|---|---|---|---|---|
convective gravity wave drag |
congwd |
congwd |
congwd |
|
deep convection |
deepcnv |
deepcnv |
deepcnv |
deepcnv |
long wave radiation |
lw |
|||
microphysics |
mp |
mp |
mp |
mp |
orographic gravity wave drag |
orogwd |
orogwd |
orogwd |
|
planetary boundary layer |
pbl |
pbl |
pbl |
pbl |
Rayleigh damping |
rdamp |
rdamp |
rdamp |
|
shallow convection |
shalcnv |
shalcnv |
shalcnv |
shalcnv |
short wave radiation |
sw |
|||
total physics (all above) |
phys |
phys |
phys |
phys |
dynamics |
nophys |
nophys |
nophys |
nophys |
state variable at validtime |
tmp |
spfh |
ugrd |
vgrd |
actual change in state var |
dtmp |
dspfh |
dugrd |
dvgrd |
The expected names of the netCDF variables in the history file are shown below. If your history file is different, one can change them in YAML config file $METPLOTPY_BASE/test/fv3_physics_tend/fv3_physics_tend_defaults.yaml
NOTE: $METPLOTPY_BASE is the directory where the METplotpy code is saved (e.g. /path/to/user/dir/METplotpy).
tendency |
temperature |
specific humidity |
u-wind |
v-wind |
|---|---|---|---|---|
convective gravity wave drag |
dt3dt_congwd |
du3dt_congwd |
dv3dt_congwd |
|
deep convection |
dt3dt_deepcnv |
dq3dt_deepcnv |
du3dt_deepcnv |
dv3dt_deepcnv |
long wave radiation |
dt3dt_lw |
|||
microphysics |
dt3dt_mp |
dq3dt_mp |
du3dt_mp |
dv3dt_mp |
orographic gravity wave drag |
dt3dt_orogwd |
du3dt_orogwd |
dv3dt_orogwd |
|
planetary boundary layer |
dt3dt_pbl |
dq3dt_pbl |
du3dt_pbl |
dv3dt_pbl |
Rayleigh damping |
dt3dt_rdamp |
du3dt_rdamp |
dv3dt_rdamp |
|
shallow convection |
dt3dt_shalcnv |
dq3dt_shalcnv |
du3dt_shalcnv |
dv3dt_shalcnv |
short wave radiation |
dt3dt_sw |
|||
total physics (all above) |
dt3dt_phys |
dq3dt_phys |
du3dt_phys |
dv3dt_phys |
dynamics |
dt3dt_nophys |
dq3dt_nophys |
du3dt_nophys |
dv3dt_nophys |
25.4. Example
25.4.1. Sample Data
Sample data to plot physics tendencies are available in the METplus data tar file in the directory xxx/fv3_physics_tend.
Save this file in a directory where you have read and write permissions, such as $WORKING_DIR/data/fv3_physics_tend, where $WORKING_DIR is the path to the directory where you will save input data.
25.4.2. Configuration File
There is a YAML config file located in $METPLOTPY_BASE/test/fv3_physics_tend/fv3_physics_tend_defaults.yaml
# Names of tendency variables in model output (i.e. FV3 history file)
# Each type of tendency (moisture, temperature, wind component) has its own set of variables.
tendency_varnames:
    spfh:
    - dq3dt_deepcnv
    - dq3dt_mp
    - dq3dt_pbl
    - dq3dt_shalcnv
    - dq3dt_nophys
    tmp:
    - dt3dt_congwd
    - dt3dt_deepcnv
    - dt3dt_lw
    - dt3dt_mp
    - dt3dt_orogwd
    - dt3dt_pbl
    - dt3dt_rdamp
    - dt3dt_shalcnv
    - dt3dt_sw
    - dt3dt_nophys
    ugrd:
    - du3dt_congwd
    - du3dt_deepcnv
    - du3dt_mp
    - du3dt_orogwd
    - du3dt_pbl
    - du3dt_rdamp
    - du3dt_shalcnv
    - du3dt_nophys
    vgrd:
    - dv3dt_congwd
    - dv3dt_deepcnv
    - dv3dt_mp
    - dv3dt_orogwd
    - dv3dt_pbl
    - dv3dt_rdamp
    - dv3dt_shalcnv
    - dv3dt_nophys

# Name of variables in history file that contain the temperature, moisture, wind at time zero (initialization time).
time0_varname:
    tmp :  tmp_i
    spfh:   qv_i
    ugrd: ugrd_i
    vgrd: vgrd_i


# Name of the longitude and latitude variables in the grid specification file.
lon_name : "grid_lont"
lat_name : "grid_latt"


# Geographic extent (in degrees) of 2-D plots.
# (lonmin, lonmax, latmin, latmax)
extent:
    - -122
    - -72.7
    - 22.1
    - 49.5

# Found FV3 standard_parallel by trial and error with smaller and smaller tolerances given to mepy.assign_y_x(). longitude is mean.
standard_parallel : 38.139

# color map
cmap : "Spectral_r"

# resolution (dots per inch) of output
dpi : 150
$METPLOTPY_BASE is the directory where the METplotpy code is saved.
25.5. Run from the Command Line
To generate example tendency plots using settings in the fv3_physics_defaults.yaml configuration file, perform the following:
setenv CONFIG $METPLOTPY_BASE/test/fv3_physics_tend/fv3_physics_tend_defaults.yaml
setenv WORKING_DIR $METPLOTPY_BASE/metplotpy/contributed/fv3_physics_tend
cd $WORKING_DIR
python planview_fv3.py -h
25.5.1. Plan view
usage: planview_fv3.py [-h] [-d] [--method {nearest,linear,loglinear}] [--ncols NCOLS]
                       [--nofineprint] [-o OFILE] [-p PFULL [PFULL ...]] [-s SHP]
                       [--subtract SUBTRACT] [-t TWINDOW] [-v VALIDTIME]
                       config historyfile gridfile statevariable fill

Plan view of FV3 diagnostic tendency

positional arguments:
  config                yaml configuration file
  historyfile           FV3 history file
  gridfile              FV3 grid spec file
  statevariable         moisture, temperature, or wind component variable name
  fill                  type of tendency. ignored if pfull is a single level

optional arguments:
  -h, --help            show this help message and exit
  -d, --debug
  --method {nearest,linear,loglinear}
                        vertical interpolation method (default: nearest)
  --ncols NCOLS         number of columns (default: None)
  --nofineprint         Don't add metadata and created by date (for comparing images)
                        (default: False)
  -o OFILE, --ofile OFILE
                        name of output image file (default: None)
  -p PFULL [PFULL ...], --pfull PFULL [PFULL ...]
                        pressure level(s) in hPa to plot. If only one pressure level is
                        provided, the type-of-tendency argument will be ignored and all
                        tendencies will be plotted. (default: [1000, 925, 850, 700, 500,
                        300, 200, 100, 0])
  -s SHP, --shp SHP     shape file directory for mask (default: None)
  --subtract SUBTRACT   FV3 history file to subtract (default: None)
  -t TWINDOW, --twindow TWINDOW
                        time window in hours (default: 3)
  -v VALIDTIME, --validtime VALIDTIME
                        valid time (default: None)
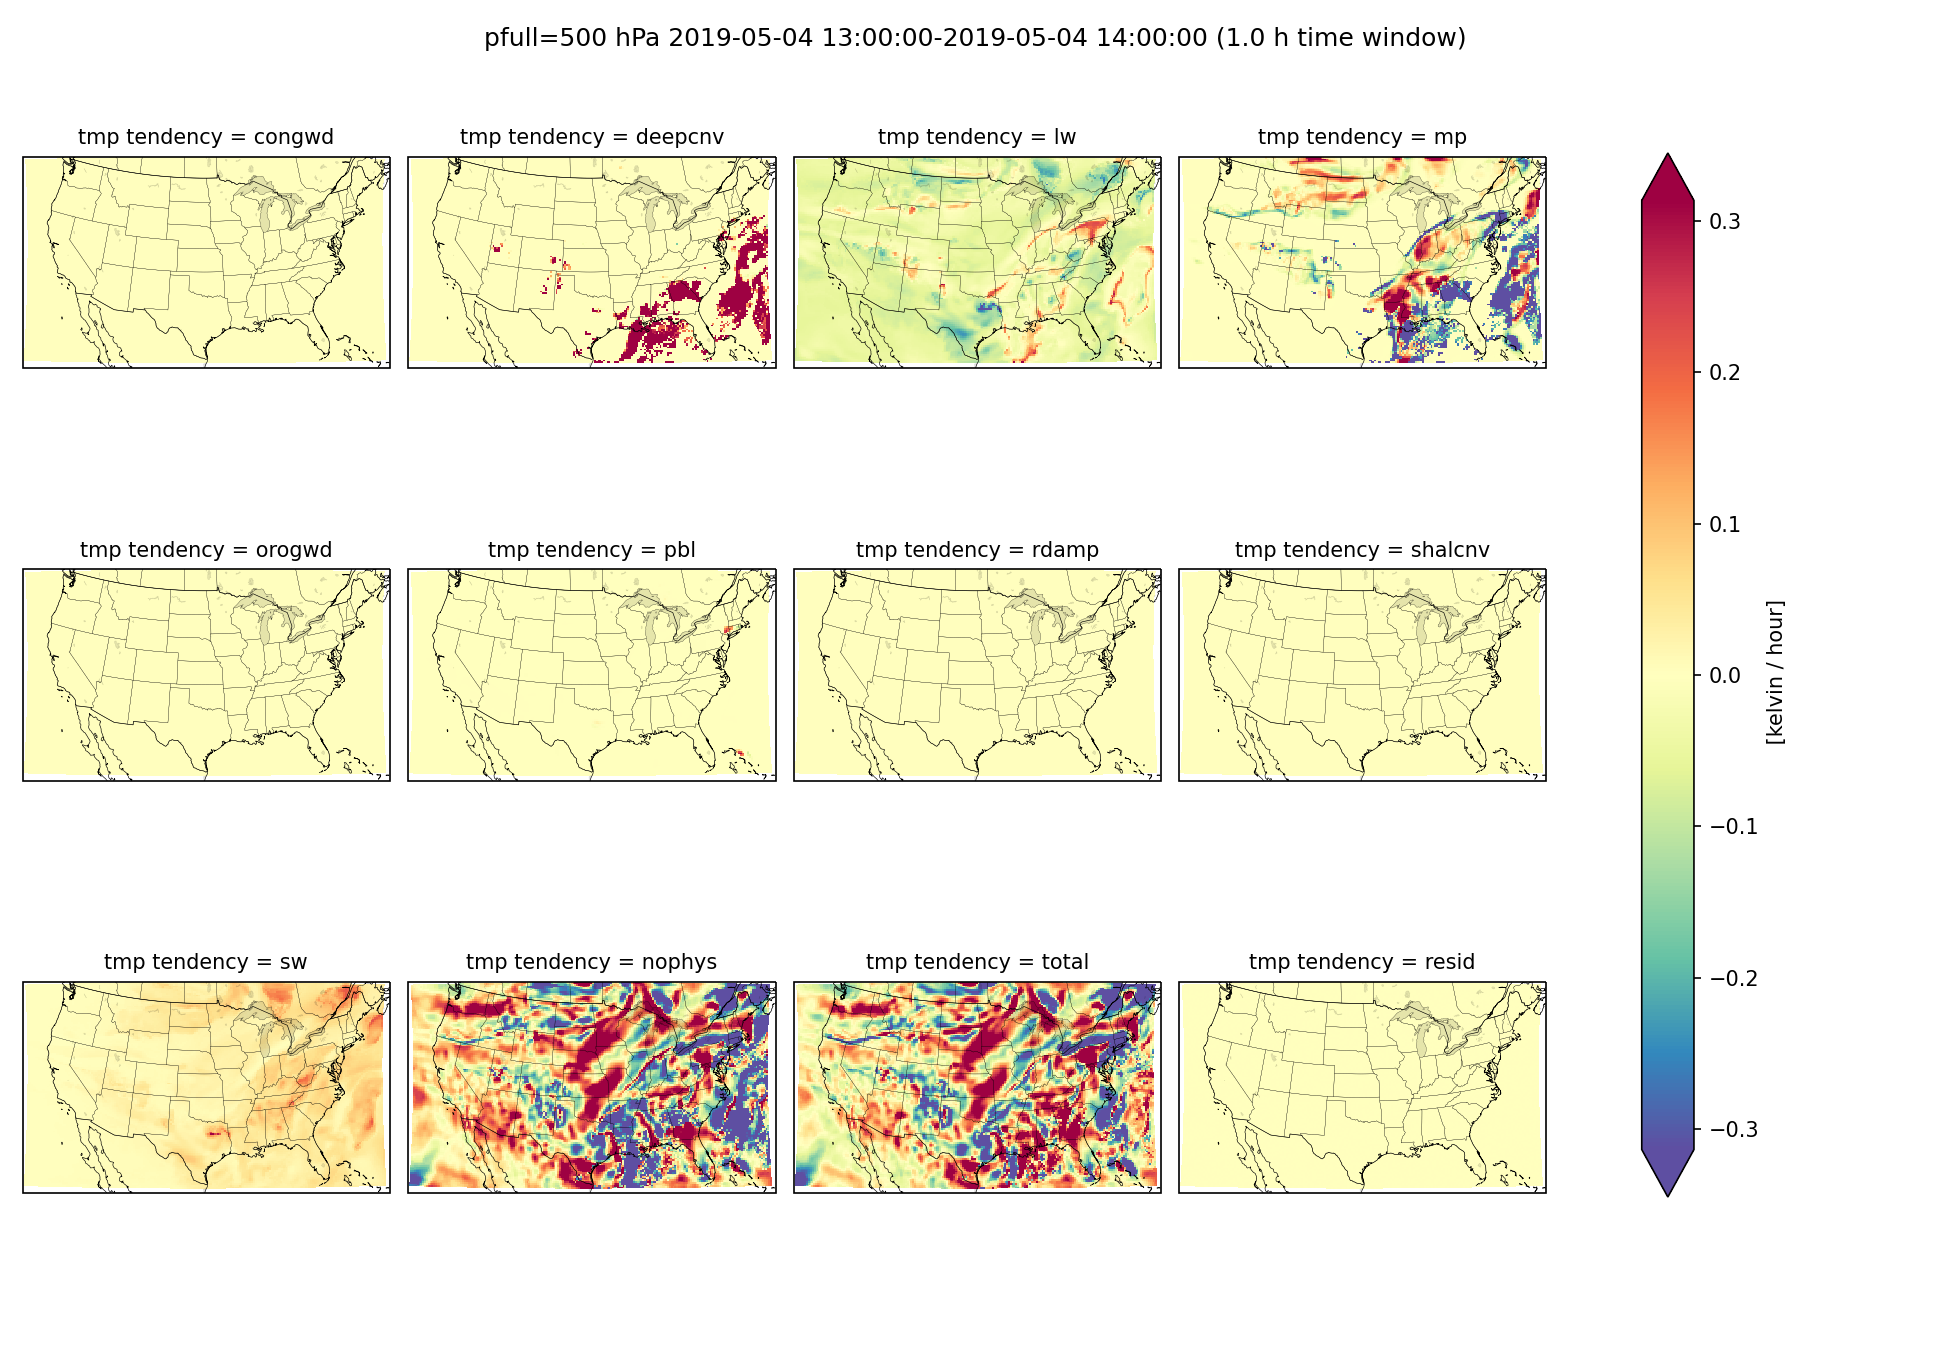
Generate a plan view of all tendencies at 500 hPa:
python planview_fv3.py $CONFIG $WORKING_DIR/fv3_history.nc $WORKING_DIR/grid_spec.nc tmp pbl -p 500 -t 1 -v 20190504T14 --nofineprint
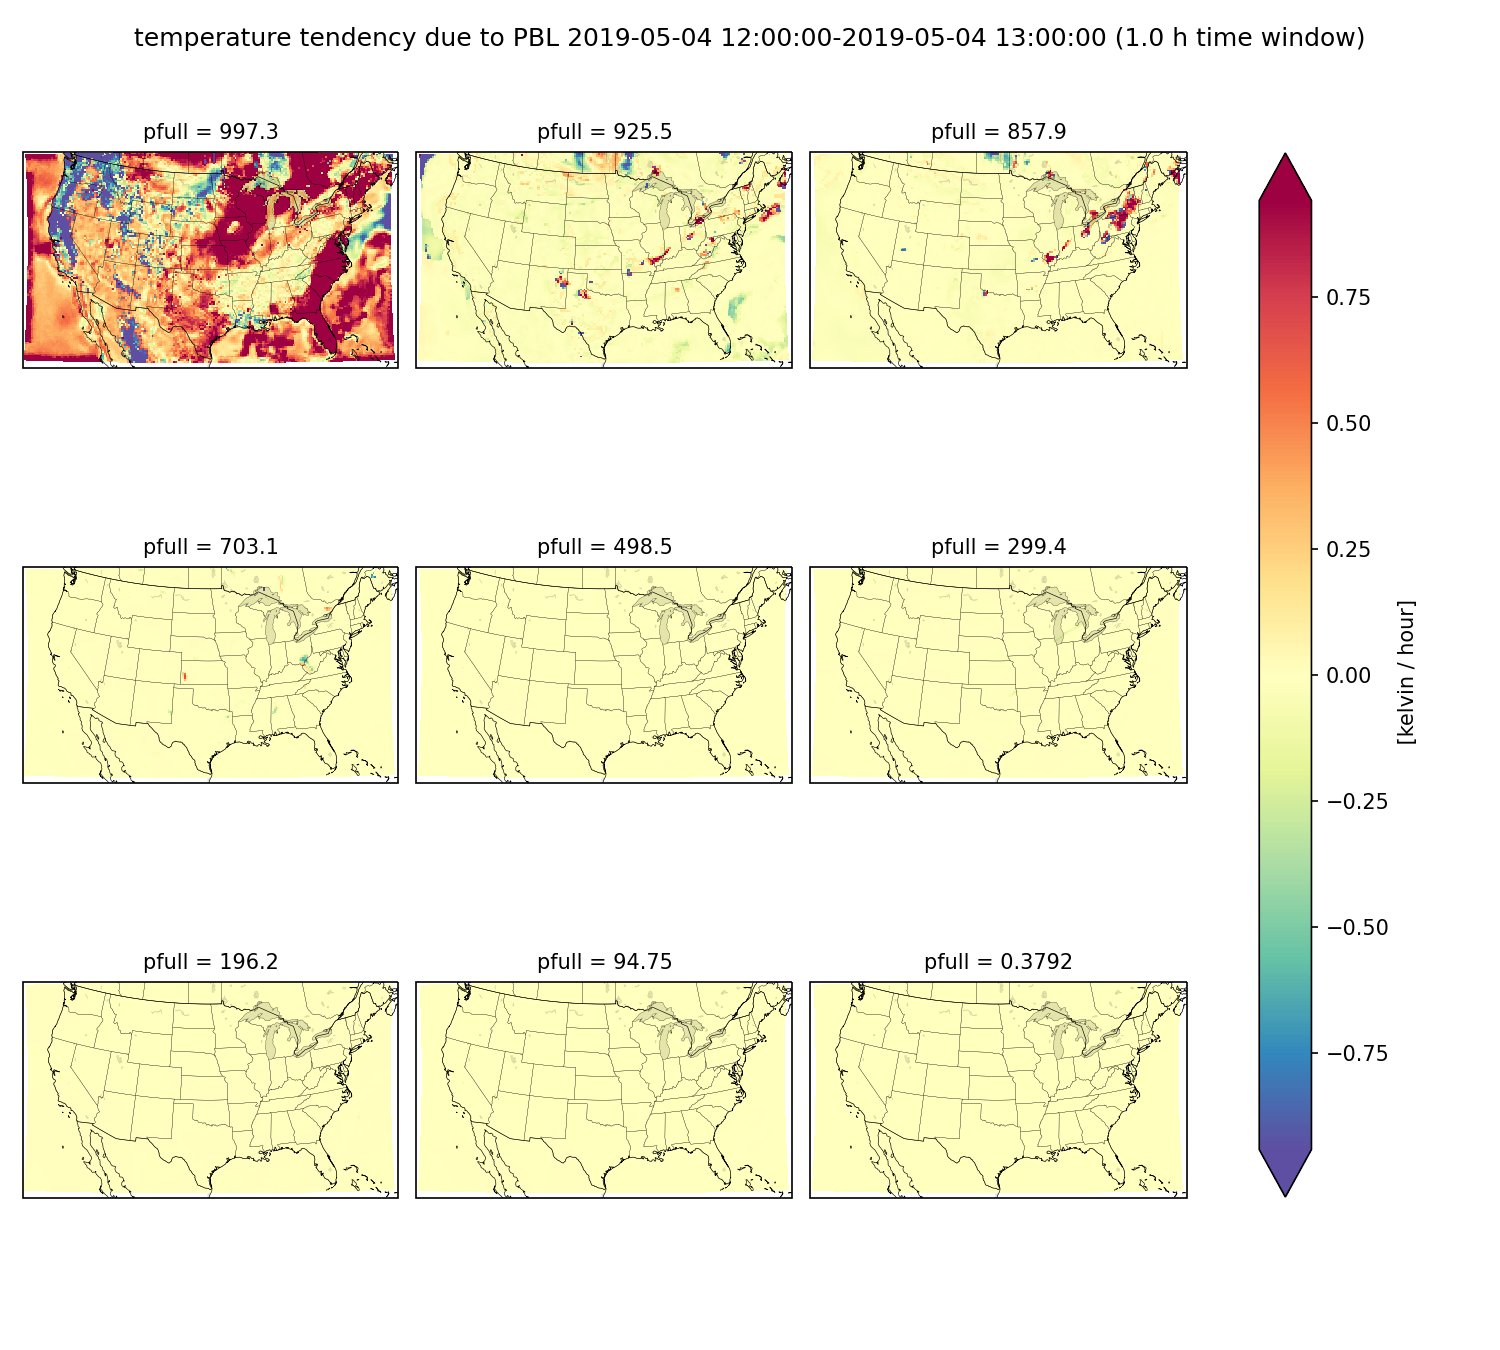
Generate a plan view of PBL tendency at default pressure levels:
python planview_fv3.py $CONFIG $WORKING_DIR/fv3_history.nc $WORKING_DIR/grid_spec.nc tmp pbl -t 1 -v 20190504T13 --nofineprint
python vert_profile_fv3.py -h
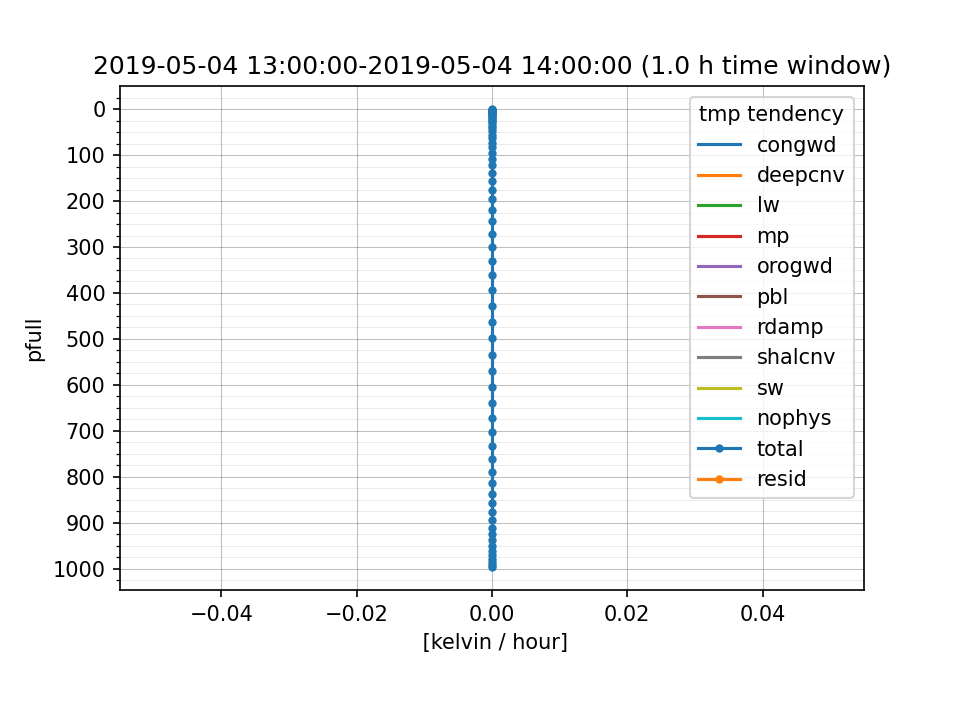
25.5.2. Vertical profile
usage: vert_profile_fv3.py [-h] [-d] [--nofineprint] [-o OFILE] [--resid] [-s SHP]
                           [--subtract SUBTRACT] [-t TWINDOW] [-v VALIDTIME]
                           config historyfile gridfile statevariable

Vertical profile of FV3 diagnostic tendencies

positional arguments:
  config                yaml configuration file
  historyfile           FV3 history file
  gridfile              FV3 grid spec file
  statevariable         moisture, temperature, or wind component variable name

optional arguments:
  -h, --help            show this help message and exit
  -d, --debug
  --nofineprint         Don't add metadata and created by date (for comparing images)
                        (default: False)
  -o OFILE, --ofile OFILE
                        name of output image file (default: None)
  --resid               calculate residual (default: False)
  -s SHP, --shp SHP     shape file directory for mask (default: None)
  --subtract SUBTRACT   FV3 history file to subtract (default: None)
  -t TWINDOW, --twindow TWINDOW
                        time window in hours (default: 3)
  -v VALIDTIME, --validtime VALIDTIME
                        valid time (default: None)
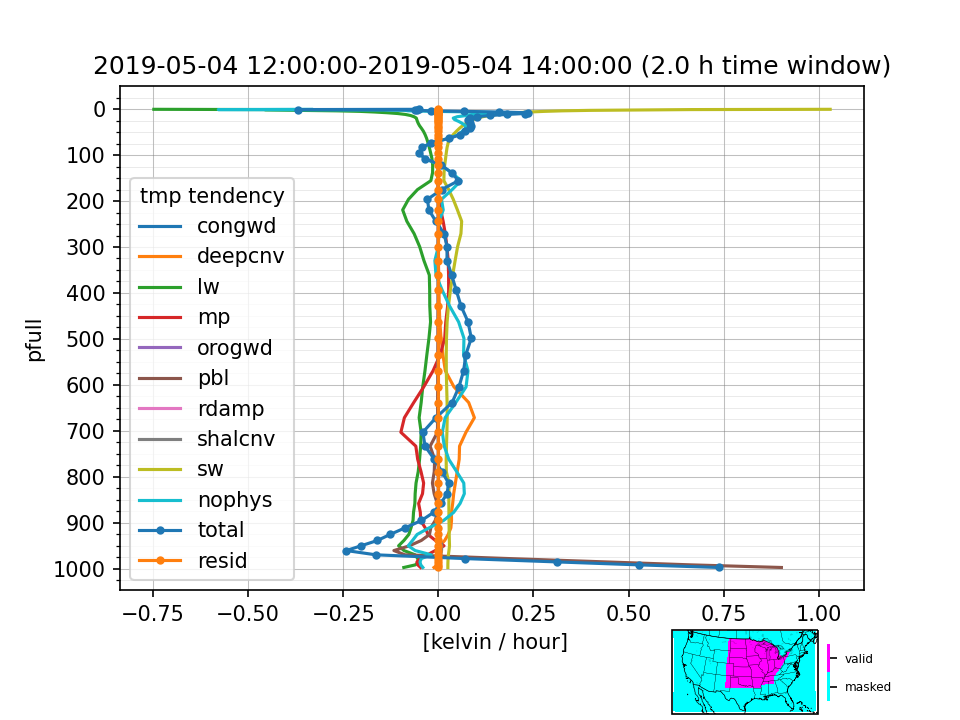
Generate vertical profile of temperature tendencies averaged over the mid-CONUS region:
python vert_profile_fv3.py $CONFIG $WORKING_DIR/fv3_history.nc $WORKING_DIR/grid_spec.nc tmp -t 2 -v 20190504T14 -s $METPLOTPY_BASE/metplotpy/contributed/fv3_physics_tend/shapefiles/MID_CONUS --nofineprint
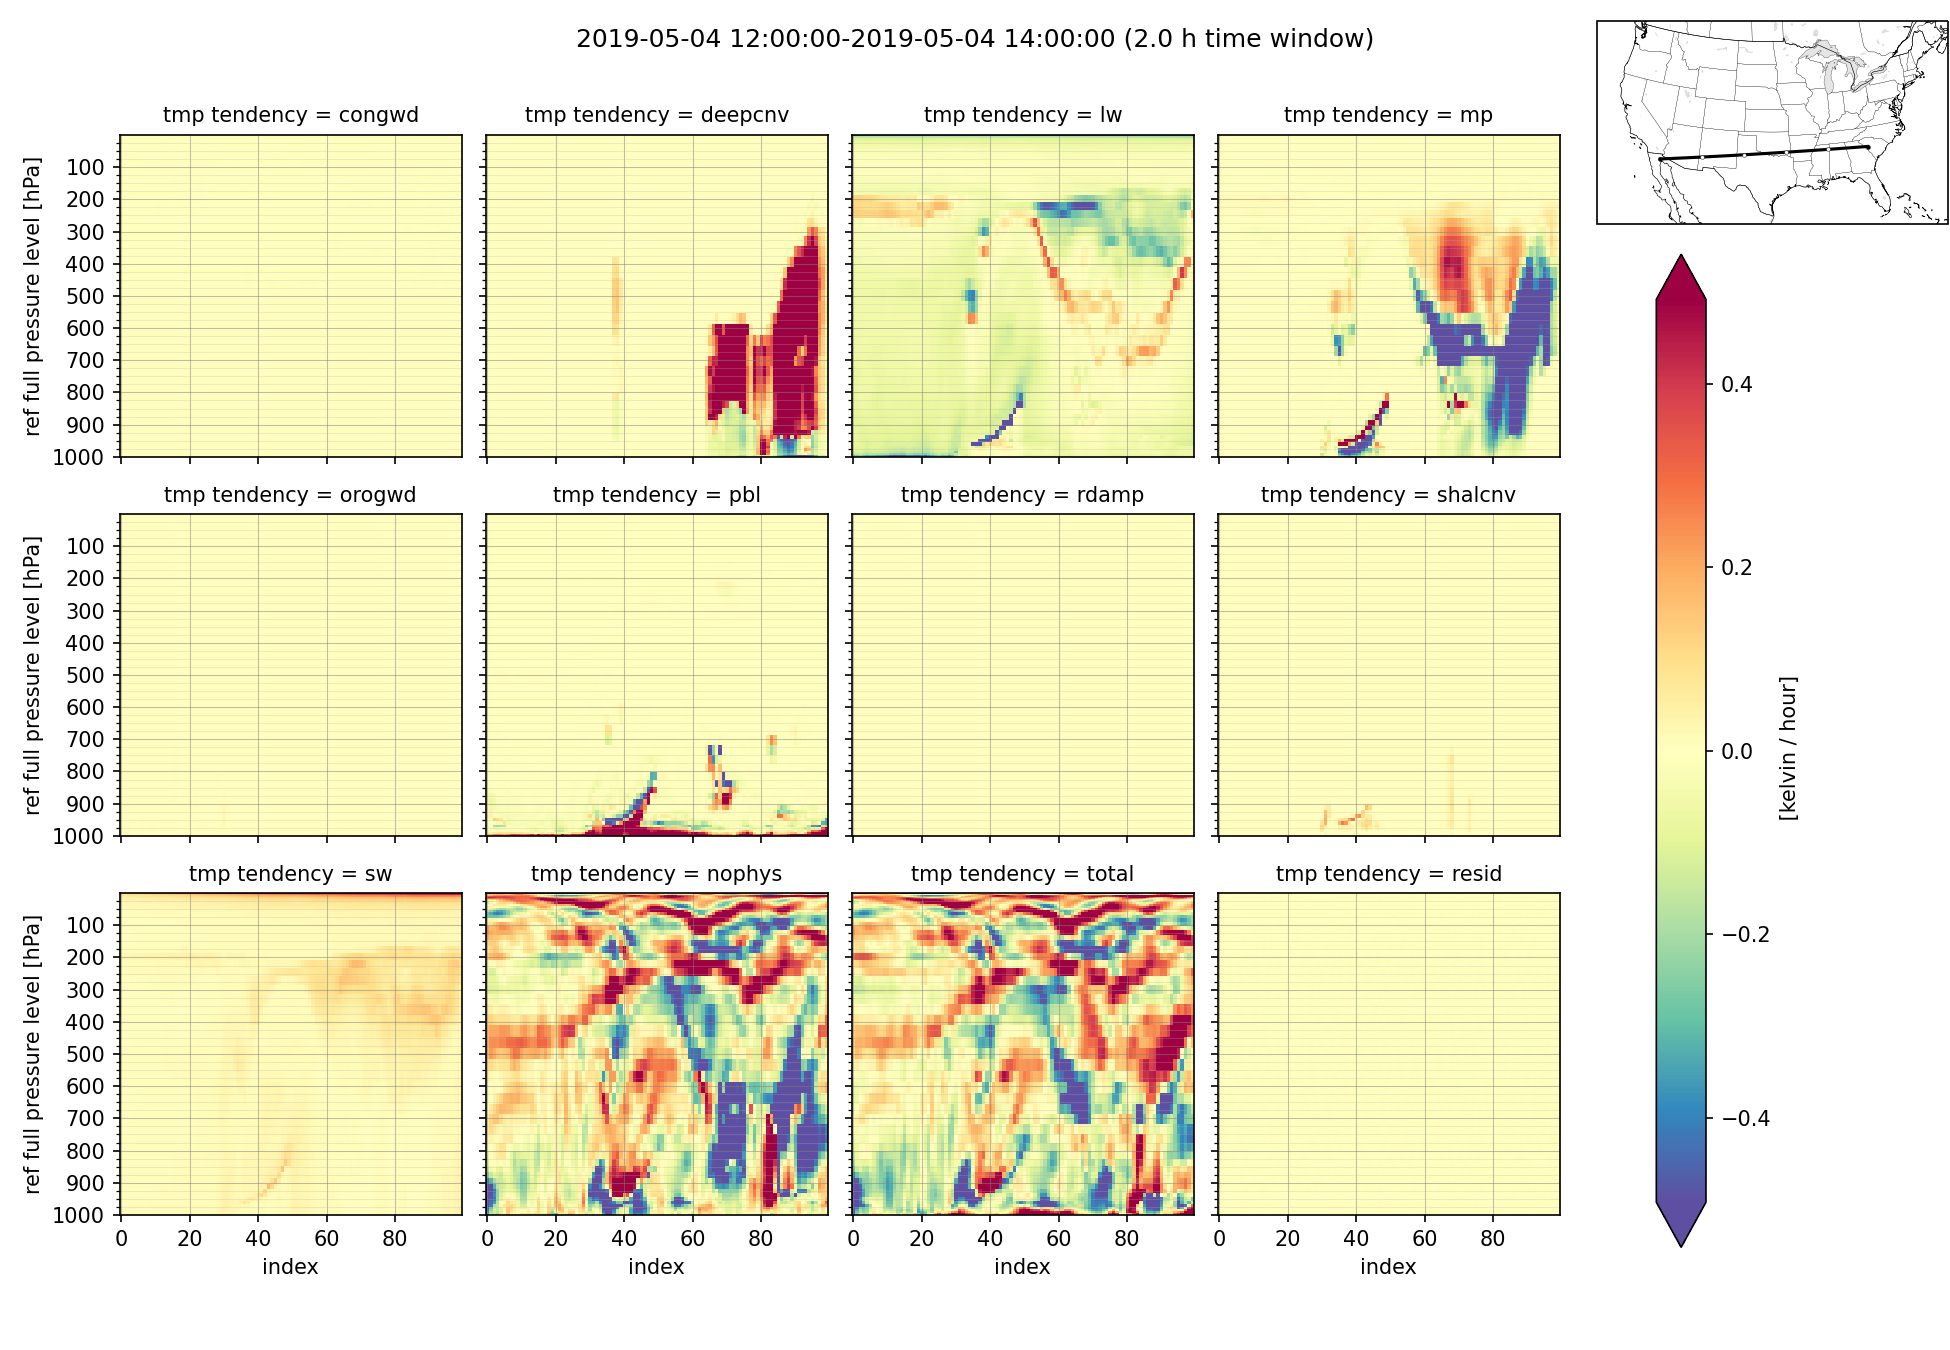
25.5.3. Vertical cross section
python cross_section_vert.py -h
Usage:
usage: cross_section_vert.py [-h] [-d] [--dindex DINDEX] [--ncols NCOLS] [--nofineprint]
                             [-o OFILE] [-s START START] [-e END END]
                             [--subtract SUBTRACT] [-t TWINDOW] [-v VALIDTIME]
                             config historyfile gridfile statevariable

Vertical cross section of FV3 diagnostic tendency

positional arguments:
  config                yaml configuration file
  historyfile           FV3 history file
  gridfile              FV3 grid spec file
  statevariable         moisture, temperature, or wind component variable name

optional arguments:
  -h, --help            show this help message and exit
  -d, --debug
  --dindex DINDEX       tick and gridline interval along cross section (default: 20)
  --ncols NCOLS         number of columns (default: None)
  --nofineprint         Don't add metadata and created by date (for comparing images)
                        (default: False)
  -o OFILE, --ofile OFILE
                        name of output image file (default: None)
  -s START START, --start START START
                        start point (default: (28, -115))
  -e END END, --end END END
                        end point (default: (30, -82))
  --subtract SUBTRACT   FV3 history file to subtract (default: None)
  -t TWINDOW, --twindow TWINDOW
                        time window in hours (default: 3)
  -v VALIDTIME, --validtime VALIDTIME
                        valid time (default: None)
Generate vertical cross section from 32°N 115°W to 34°N 82°W:
python cross_section_vert.py $CONFIG $WORKING_DIR/fv3_history.nc $WORKING_DIR/grid_spec.nc tmp -t 2 -v 20190504T14 -s 32 -115 -e 34 -82 --nofineprint
25.5.4. Difference plot
Put file you want to subtract after the –subtract argument:
python vert_profile_fv3.py $CONFIG $WORKING_DIR/fv3_history.nc $WORKING_DIR/grid_spec.nc tmp -t 1 --subtract $WORKING_DIR/fv3_history.nc --nofineprint