21. Stratosphere Diagnostics Plots
21.1. Description
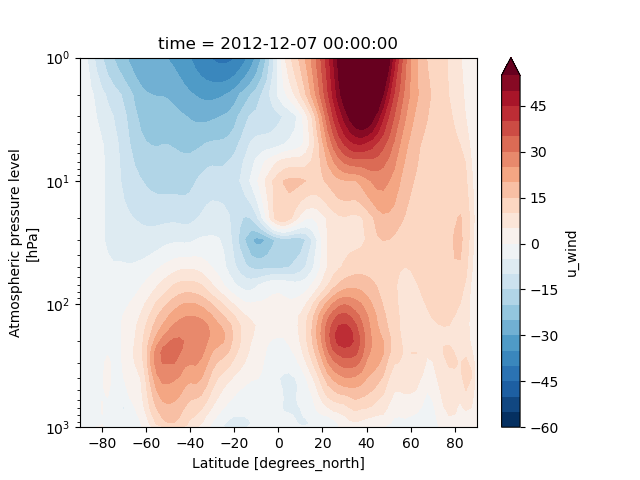
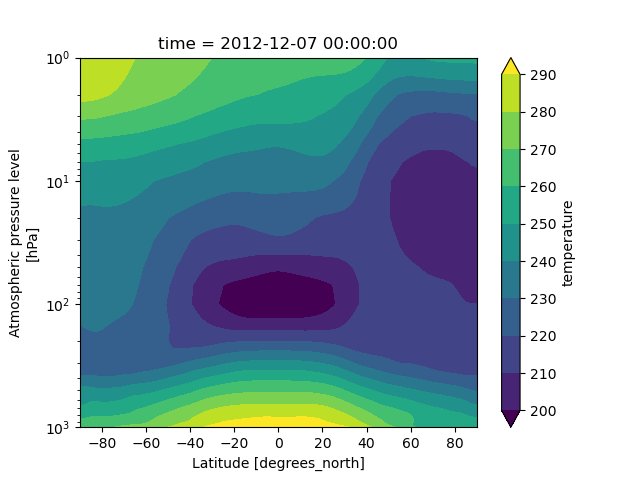
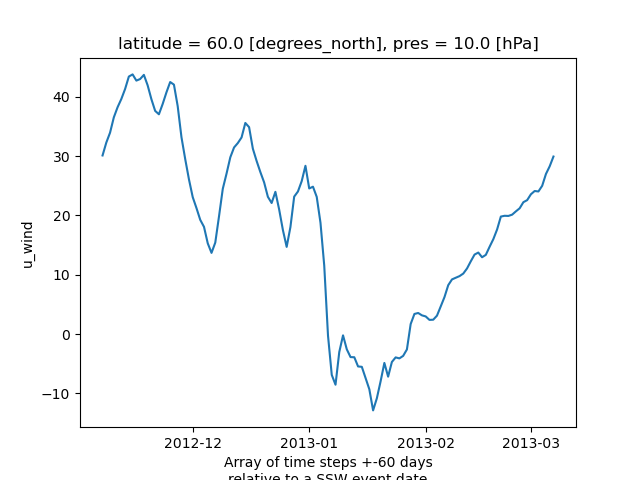
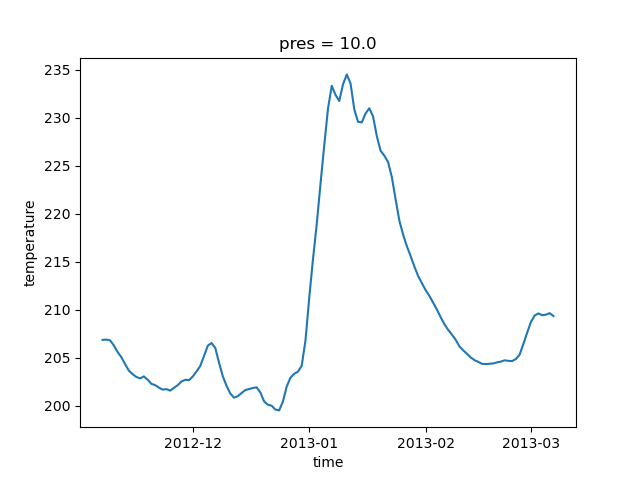
The stratosphere_diagnostics.py code (found in the METplotpy repository) provides a starting point for the creation of four plots: the contour plot of the zonal mean wind, the contour plot of the zonal mean temperature, a line plot for zonal mean wind, and a line plot for the meridional mean temperature for the polar cap:
Contour plot of zonal mean wind:
Contour plot of zonal mean temperature:
Line plot zonal mean wind:
Line plot meridional mean temperature at the pole:
The directional_means.py module in the METcalcpy repository is used to calculate the zonal and meridional means from the input data. The stratosphere_diagnostics.py module is based on code provided by Zach D. Lawrence (CIRES/CU, NOAA/PSL) and the directional_means.py module is based on the pyzome package (also provided by Zach Lawrence). A METplus use case illustrates how to use the directional_means module to calculate zonal and meridional means on sample data.
21.2. Required Packages
Packages that are followed by version number require that specific version number (or later).
Python 3.7
plotly
matplotlib 3.5
nc-time-axis 1.4.0
netCDF4
numpy
PyYAML
scipy
xarray
21.3. Example
21.3.1. Sample Data
The sample dataset is a netCDF file: SSWC_v1.0_varFull_ERAi_d20130106_s20121107_e20130307_c20160701.nc
To obtain this data follow these steps, based on the instructions from the section 2.6 of the METplus installation section :
Create a directory where you will save the sample data, hereafter referred to as $INPUT_DATA_DIR.
Go to the sample input data link.
Click on the most recent version number (in the format vX.Y).
Click on the sample_data_s2s-X.Y.tgz (where X.Y is the version number).
Copy this compressed tar ball to your $INPUT_DATA_DIR directory.
Change directory to the $INPUT_DATA_DIR directory.
Uncompress the tar ball:
Example:
tar -zxvf sample_data_s2s-4.1.tgz
The file you need is in the $INPUT_DATA_DIR/model_applications/s2s/UserScript_obsERA_obsOnly_Stratosphere directory, where $INPUT_DATA_DIR is the directory you created to store your sample data.
21.4. METplus Configuration
The stratosphere_diagnostics plotting module utilizes a YAML configuration file to indicate where input and output files are located, and to set plotting attributes. YAML is a recursive acronym for “YAML Ain’t Markup Language” and according to yaml.org, it is a “human-friendly data serialization language”. It is commonly used for configuration files and in applications where data is being stored or transmitted.
#
# Input and Output Information
#
input_data_path: /path/to/input/directory
input_datafile: SSWC_v1.0_varFull_ERAi_d20130106_s20121107_e20130307_c20160701.nc
output_plot_path: /path/to/output
#
# Output plot filenames
# ***Must include the .png extension to the filename***
zonal_mean_wind_contour_output_plotname: zonal_mean_wind_contour.png
zonal_mean_temperature_output_plotname: zonal_mean_temperature_contour.png
zonal_mean_wind_output_plotname: zonal_mean_wind.png
polar_cap_meridional_mean_temp_output_plotname: polar_cap_meridional_mean_temp.png

#
# Variables used in plotting, corresponding to the names in the input datafile.
# When using your own data, replace the time, temperature, level, and wind variable names
# that correspond to your data's variable names (e.g if your time variable name is 'time',
# replace timeEv60 with 'time').
#
variables:
  # time variable name in input data
  - timeEv60
  # lat variable name in input data
  - lat
  # lon variable name in input data
  - lon
  # U-component of wind variable name in input data
  - uwndFull_TS
  # V-component of wind variable name in input data
  - vwndFull_TS
  # Temperature variable name in input data
  - tempFull_TS
  # Level variable name in input data
  - geopFull_TS

#
# Contour plot settings
#

#
# Zonal mean wind contour plot settings
#
zonal_mean_wind_contour_time_index: 30
zonal_mean_wind_contour_level_start: -60
zonal_mean_wind_contour_level_end: 60
zonal_mean_wind_contour_level_step_size: 5
zonal_mean_wind_yscale: log

#
# Zonal mean temperature contour plot settings
#
zonal_mean_temp_contour_time_index: 30
zonal_mean_temp_contour_level_start: 200
zonal_mean_temp_contour_level_end: 300
zonal_mean_temp_contour_level_step_size: 10
zonal_mean_temp_yscale: log

#
#  Line plot settings for zonal mean wind plot.
#
zonal_mean_wind_latitude: 60
# pressure in hPa
zonal_mean_wind_pressure_hpa: 10

# Line plot settings for polar cap meridional mean temperature plot.
polar_cap_lat_start: 60
polar_cap_lat_end: 90
# pressure in hPa
polar_cap_pressure_hpa: 10
Copy the stratosphere_diagnostics.yaml file from your $METPLOTPY_BASE (where $METPLOTPY_BASE is the directory where the METplotpy source code was saved) to your $WORKING_DIR (the directory where you have write and execute privileges):
cp $METPLOTPY_BASE/metplotpy/contributed/stratosphere_diagnostics/stratosphere_diagnostics.yaml $WORKING_DIR/stratosphere_diagnostics.yaml
Modify the input_data_path setting in the $WORKING_DIR/stratosphere_diagnostics.yaml by replacing the /path/to/input/directory entry with the directory where you saved your sample data. This is the $INPUT_DATA_DIR you used from the Sample Data section above.
Replace the output_plot_path setting from /path/to/output to a directory where you wish to store your output.
21.5. Run from the Command Line
Perform the following:
To use the conda environment, verify the conda environment is running and has has the required Python packages specified in the Required Packages section above.
Set the METPLOTPY_BASE environment variable to point to $METPLOTPY_BASE
For the ksh environment:
export METPLOTPY_BASE=$METPLOTPY_BASE
For the csh environment:
setenv METPLOTPY_BASE $METPLOTPY_BASEReplacing the $METPLOTPY_BASE with the directory where the METplotpy source code was saved.
Enter the following command:
python $METPLOTPY_BASE/metplotpy/contributed/stratosphere_diagnostics/stratosphere_diagnostics.py $WORKING_DIR/stratosphere_diagnostics.yamlFour .png files will be created in the output directory you specified in the stratosphere_diagnostics.yaml config file:
zonal_mean_temperature_contour.png
zonal_mean_wind_contour.png
zonal_mean_wind.png
polar_cap_meridional_mean_temp.png
These plots correspond to the plots shown above.