9. Performance Diagram
9.1. Description
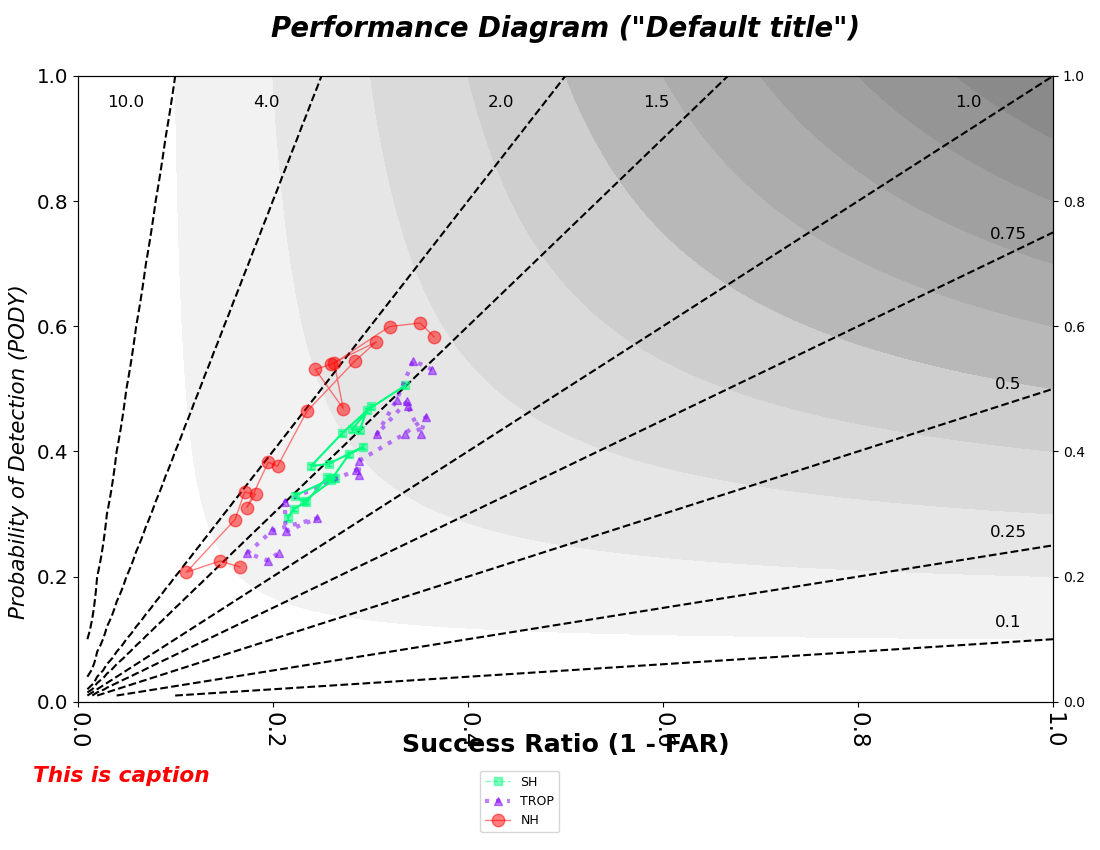
Performance diagrams are used to show the relationship between categorical statistics, with axes representing detection and success (1 - false alarm) rates (Roebber, 2009). The simplest input to the performance diagram is the MET contingency table statistics (CTS) output. This output can be produced by many of the MET tools (Point-Stat, Grid-Stat, etc.) For more information on Performance diagrams, please refer to the METviewer documentation.
There are several reference lines on the performance diagram. The dashed lines that radiate from the origin are lines of equal frequency bias. Labels for the frequency bias amount are at the end of each line. The diagonal represents a perfect frequency bias score of 1. Curves of equal Critical Success Index (CSI) connect the top of the plot to the right side. CSI amounts are listed to the right side of the plot, with better values falling closer to the top.
9.2. Example
9.2.1. Sample Data
The data is text output from MET in columnar format. The sample data used to create these plots is available in the METplotpy repository, where the performance diagram scripts are located:
$METPLOTPY_BASE/test/performance_diagram/plot_20200317_151252.data
$METPLOTPY_BASE is the directory where the METplotpy code is saved:
e.g.
/usr/path/to/METplotpy if the source code was cloned or forked from the Github repository
or
/usr/path/to/METplotpy-x.y.z if the source code was downloaded as a zip or gzip’d tar file from the Release link of the Github repository. The x.y.z is the release number.
9.2.2. Configuration Files
The performance diagram utilizes YAML configuration files to indicate where input data is located and to set plot attributes. These plot attributes correspond to values that can be set via the METviewer tool. YAML is a recursive acronym for “YAML Ain’t Markup Language” and according to yaml.org, it is a “human-friendly data serialization language. It is commonly used for configuration files and in applications where data is being stored or transmitted. Two configuration files are required. The first is a default configuration file, performance_diagram_defaults.yaml, which is found in the $METPLOTPY_BASE/metplotpy/plots/config directory. $METPLOTPY_BASE indicates the directory where the METplotpy source code has been saved. All default configuration files are located in the $METPLOTPY_BASE/metplotpy/plots/config directory. Default configuration files are automatically loaded by the plotting code and do not need to be explicitly specified when generating a plot.
The second required configuration file is a user-supplied “custom” configuration file. This file is used to customize/override the default settings in the performance_diagram_defaults.yaml file. The custom configuration file can be an empty file if all default settings are to be applied.
9.3. METplus Configuration
9.3.1. Default Configuration File
The following is the mandatory, performance_diagram_defaults.yaml configuration file, which serves as a starting point for creating a performance diagram plot, as it represents the default values set in METviewer.
NOTE: This default configuration file is automatically loaded by performance_diagram.py.
---
# Default settings specific to performance diagram plot
# Line and marker plots of series data of Success Rate (1-FAR) on x-axis vs. PODY on y-axis.
title: Performance Diagram ("Default title")
title_weight: 4

# Write points file. Set to True for METviewer use,
# False otherwise
dump_points_1: 'False'

# unsupported, Matplotlib align choices are left, right, center and
# offset is automatically chosen to avoid labels and ticks on the topmost
# x-axis
title_align: 0.5
title_offset: -2
title_size: 1.8
xaxis: Success Ratio (1 - FAR)
yaxis_1: Probability of Detection (PODY)
yaxis_2:
plot_width: 11
plot_height: 8.5
plot_res: 72
plot_units: cm
plot_ci:
  - none
  - met_prm
  - None
plot_disp:
  - True
  - True
  - True
series_order:
  - 3
  - 1
  - 2
indy_var: fcst_valid_beg
indy_vals:
  # defining the datetimes of interest
  - 2016-08-12 06:00:00
  - 2016-08-12 12:00:00
  - 2016-08-12 18:00:00
  - 2016-08-13 00:00:00
  - 2016-08-13 06:00:00
  - 2016-08-13 12:00:00
  - 2016-08-13 18:00:00
  - 2016-08-14 00:00:00
  - 2016-08-14 06:00:00
  - 2016-08-14 12:00:00
  - 2016-08-14 18:00:00
  - 2016-08-15 00:00:00
  - 2016-08-15 12:00:00
  - 2016-08-15 18:00:00
  - 2016-08-16 00:00:00
  - 2016-08-16 06:00:00
  - 2016-08-16 12:00:00
  - 2016-08-16 18:00:00
  - 2016-08-17 00:00:00

fcst_var_val_1:
  # Name of the variables of interest, the independent and dependent variables
  # will be the same across all fcst_var values

  # fcst_var1
  APCP_06:
    # x-axis/independent variable
    - FAR
    # y-axis/dependent variable
    - PODY
fcst_var_val_2:

series_val_1:
  # series_var_1
  model:
    # series_val_1
    - GFS_0p25_G193
  # series_var2
  vx_mask:
    # series_val_1
    - NH_CMORPH_G193
    # series_val_2
    - SH_CMORPH_G193
    # series_val_3
    - TROP_CMORPH_G193

series_val_2:
list_stat_1:
  - FAR
  - PODY
list_stat_2: []
user_legend:
  - NH
  - SH
  - TROP
# two types supported, 'n' for none and 'o' for box
legend_box: 'box'
# number of columns in legend
legend_ncol: 1
legend_inset:
  x: 0.0
  y: -0.25
legend_size: 0.8
plot_stat: median
plot_contour_legend: False
colors:
  # red
  - "#ff0000"
  # spring green
  - "#00ff7f"
  # electric indigo/vivid purple
  - "#8000ff"
series_line_width:
  - 1
  - 1
  - 3
series_symbols:
  # Other supported symbols: small circle = ".", ring/hexagon = "H", rhombus/diamond="d"
  # Circle
  - "o"
  # square
  - "s"
  # triangle
  - "^"
series_line_style:
  # solid line
  - "-"
  # dashed line
  - "--"
  # dotted line
  - ":"

# Perform event equalization to check for missing data
event_equal: False

# annotation_template: "%y in"  annotates each y-value                                             with the  units 'in' for inches, preserving the whitespace between the
# y-value and the units
# "%x <units>" will annotate each x-value (success ratio/independent variable value) with units, preserving the whitespace between the
# annotation and the units.
# if you want to annotate the independent variable:
#       annotation_template: "%y in."
# leave empty if no annotation is desired:
#       annotation_template:
# example use:
#    annotation_template: "%y in."
annotation_template:

plot_caption: "This is caption"
caption_weight: 4
caption_col: "#ff0000"
caption_size: "1.3" # relative magnification
caption_offset: 2.95  # axis perpendicular location adjustment (up/down 3.8 is max value, 2.9 is min value)
caption_align: -.1 # axis parallel location adjustment (left/right)

# x-axis labels
xlab_size:  1.3
#up-down positioning
xlab_align: .5
#left-right positioning
xlab_offset: 2
# text weight: plain text, bold, italic, bold italic
xlab_weight: 2

# x-axis ticks
#these are unsupported
xtlab_orient: 2
xtlab_size: 1.5

# y-axis labels
ylab_size: 1.1
#left-right positioning
ylab_align: 0.5
#up-down positioning
ylab_offset:  -2
# text weight: plain text, bold, italic, bold italic
ylab_weight: 3

# y-axis ticks
ytlab_orient: 1
ytlab_size: 1.3

stat_input:  ../../test/performance_diagram/plot_20200317_151252.data
plot_filename: ./performance_diagram_default.png
9.3.2. Custom Configuration File
A second, mandatory configuration file is required, which is used to customize the settings to the performance diagram plot. The custom_performance_diagram.yaml file is included with the source code and looks like the following:
---
# Custom settings specific to performance diagram plot
# Write points file. Set to True for METviewer use,
# False otherwise
dump_points_1: 'False'

# Optional, uncomment and set to directory to store the .points1 file
# that is used by METviewer (created when dump_points_1 is set to True)
# if dump_points_1 is True and this is uncommented, the points1 file
# will be saved in the default location (i.e. where the input data file is stored).
#points_path: /dir_to_save_points1_file


# Line and marker plots of series data of Success Rate (1-FAR) on x-axis vs. PODY on y-axis.
title: Performance Diagram ("Custom title")
xaxis: Success Ratio
# support two y-axes
yaxis_1: Probability of Detection (PODY)
yaxis_2: ''
legend_ncol: 1
plot_disp:
  - True
  - True
  - True
series_order:
  - 2
  - 1
  - 3
indy_var: fcst_valid_beg
indy_vals:
  # defining the datetimes of interest
  - 2016-08-12 06:00:00
  - 2016-08-12 12:00:00
  - 2016-08-12 18:00:00
  - 2016-08-13 00:00:00
  - 2016-08-13 06:00:00
  - 2016-08-13 12:00:00
  - 2016-08-13 18:00:00
  - 2016-08-14 00:00:00
  - 2016-08-14 06:00:00
  - 2016-08-14 12:00:00
  - 2016-08-14 18:00:00
  - 2016-08-15 00:00:00
  - 2016-08-15 12:00:00
  - 2016-08-15 18:00:00
  - 2016-08-16 00:00:00
  - 2016-08-16 06:00:00
  - 2016-08-16 12:00:00
  - 2016-08-16 18:00:00
  - 2016-08-17 00:00:00

# support two series values
series_val_1:
  model:
    - GFS_0p25_G193
  vx_mask:
    - NH_CMORPH_G193
    - SH_CMORPH_G193
    - TROP_CMORPH_G193
series_val_2: {}
fcst_var_val_1:
  # Name of the variables of interest, the independent and dependent variables
  # will be the same across all fcst_var values

  # fcst_var1
  APCP_06:
    # x-axis/independent variable
    - FAR
    # y-axis/dependent variable
    - PODY
fcst_var_val_2:
user_legend:
   - NH
   - ''
   - TROP

plot_stat: median
colors:
  # red
  - "#ff0000"
  # limegreen, as name of color
  - limegreen
  # electric indigo/vivid purple
  - "#8000ff"
series_line_width:
  - 1
  - 1
  - NA
series_symbols:
  # Other supported symbols: small circle = ".", ring/hexagon = "H", rhombus/diamond="d"
  # Circle
  - "o"
  # square
  - "s"
  # triangle
  #- "^"
  # ring
  - "H"
series_line_style:
  # solid line
  - "-"
  # dashed line
  - "--"
  # dotted line
  - ":"
stat_input:  ./plot_20200317_151252.data
plot_filename: ./performance_diagram_actual.png
event_equal: False
Copy this custom config file from the directory where the source code was saved to the working directory:
cp $METPLOTPY_BASE/test/performance_diagram/custom_performance_diagram.yaml $WORKING_DIR/custom_performance_diagram.yaml
Modify the stat_input setting in the $METPLOTPY_BASE/test/performance_diagram/custom_performance_diagram.yaml file to explicitly point to the $METPLOTPY_BASE/test/performance_diagram/performance_diagram directory (where the custom config files and sample data reside). Replace the relative path ./plot_20200317_151252.data with the full path $METPLOTPY_BASE/test/performance_diagram/plot_20200317_151252.data (including replacing $METPLOTPY_BASE with the full path to the METplotpy installation on the system). Modify the plot_filename setting to point to the output path where the plot will be saved, including the name of the plot.
For example:
stat_input: /username/myworkspace/METplotpy/test/performance_diagram/plot_20200317_151252.data
plot_filename: /username/working_dir/output_plots/performance_diagram_custom.png
This is where /username/myworkspace/METplotpy is $METPLOTPY_BASE and /username/working_dir is $WORKING_DIR. Make sure that the $WORKING_DIR directory that is specified exists and has the appropriate read and write permissions. The path listed for plot_filename may be changed to the output directory of one’s choosing. If this is not set, then the plot_filename setting specified in the $METPLOTPY_BASE/metplotpy/plots/config/performance_diagram_defaults.yaml configuration file will be used.
To save the intermediate .points1 file (used by METviewer and useful for debugging), set the dump_points_1 setting to True. Uncomment or add (if it doesn’t exist) the points_path setting:
dump_points_1: ‘True’
points_path: ‘/dir_to_save_points1_file’
Replace the /dir_to_save_points1_file to the same directory where the .points1 file is saved. If points_path is commented out (indicated by a ‘#’ symbol in front of it), remove the ‘#’ symbol to uncomment the points_path so that it will be used by the code. Make sure that this directory exists and has the appropriate read and write permissions. NOTE: the points_path setting is optional and does not need to be defined in the configuration file unless saving the intermediate .points1 file is desired.
9.3.3. Using defaults
To use the default settings defined in the performance_diagram_defaults.yaml file, specify a minimal custom configuration file (minimal_performance_diagram_defaults.yaml), which consists of only a comment block, but it can be any empty file (write permissions for the output filename path corresponding to the plot_filename setting in the default configuration file will be needed. Otherwise, specify a plot_filename in the minimal_performance_diagram.yaml file):
---
# Minimal settings specific to performance diagram plot
# All default values that are
# set in the performance_diagram_defaults.yaml configuration file will be
# used.
# Leave "empty" (as-is) to use all the settings in the performance_diagram.default.yaml
# as long as you have write permissions for the directory specified in the `plot_filename`
# setting. Otherwise, specify an appropriate plot_filename setting here (below this comment block)
Copy this file to the working directory:
cp $METPLOTPY_BASE/test/performance_diagram/minimal_performance_diagram.yaml $WORKING_DIR/minimal_performance_diagram.yaml
Add the stat_input (input data) and plot_filename (output file/plot path) settings to the $WORKING_DIR/minimal_performance_diagram.yaml file (anywhere below the comment block). The stat_input setting explicitly indicates where the sample data and custom configuration files are located. Set the stat_input to $METPLOTPY_BASE/test/performance_diagram/plot_20200317_151252.data and set the plot_filename to $WORKING_DIR/output_plots/performance_diagram_default.png:
stat_input: $METPLOTPY_BASE/test/performance_diagram/plot_20200317_151252.data
plot_filename: $WORKING_DIR/output_plots/performance_diagram_default.png
$WORKING_DIR is the working directory where all of the custom configuration files are being saved. Replace $METPLOTPY_BASE with the full path to the METplotpy installation on the system. NOTE: The plot_filename (output directory) may be specified to a directory other than the $WORKING_DIR/output_plots, as long as it is an existing directory where the author has read and write permissions.
To save the intermediate .points1 file (used by METviewer and useful for debugging), add the following lines to the minimal_performance_diagram.yaml file (anywhere below the comment block):
dump_points_1: ‘True’
points_path: ‘/dir_to_save_points1_file’
Replace the /dir_to_save_points1_file to the same directory where the .points file is saved. Make sure that this directory exists and has the appropriate read and write permissions.
9.4. Run from the Command Line
To generate a default performance diagram (i.e. using settings in the performance_diagram_defaults.yaml configuration file), perform the following:
If using the conda environment, verify the conda environment is running and has has the required Python packages outlined in the requirements section.
Set the METPLOTPY_BASE environment variable to point to $METPLOTPY_BASE.
For the ksh environment:
export METPLOTPY_BASE=$METPLOTPY_BASE
For the csh environment:
setenv METPLOTPY_BASE $METPLOTPY_BASEReplacing the $METPLOTPY_BASE with the directory where the METplotpy source code was saved.
Run the following on the command line:
python $METPLOTPY_BASE/metplotpy/plots/performance_diagram/performance_diagram.py $WORKING_DIR/minimal_performance_diagram.yamlThis will create a PNG file, performance_diagram_default.png, in the directory that was specified in the plot_filename setting of the minimal_performance_diagram.yaml config file:
To generate a slightly modified, customized plot, re-run the above command using the custom_performance_diagram.yaml file:
python $METPLOTPY_BASE/metplotpy/plots/performance_diagram/performance_diagram.py $WORKING_DIR/custom_performance_diagram.yaml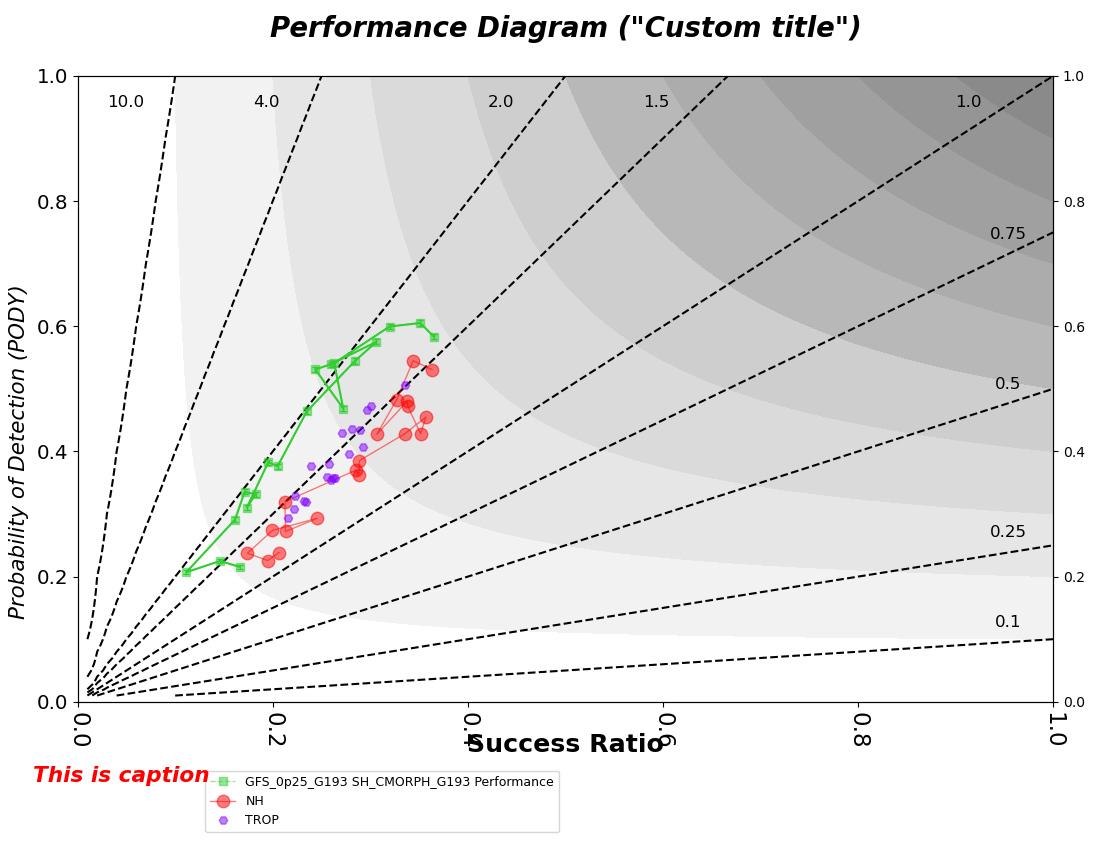
A performance_diagram_custom.png output file will be created in the directory that was specified in the plot_filename config setting in the custom_performance_diagram.yaml config file.