12. Histogram Plots
12.1. Description
Three specialized types of histogram plots are supported: rank histogram, probability histogram, and relative frequency histogram. These plots are customized versions of the histogram plot.
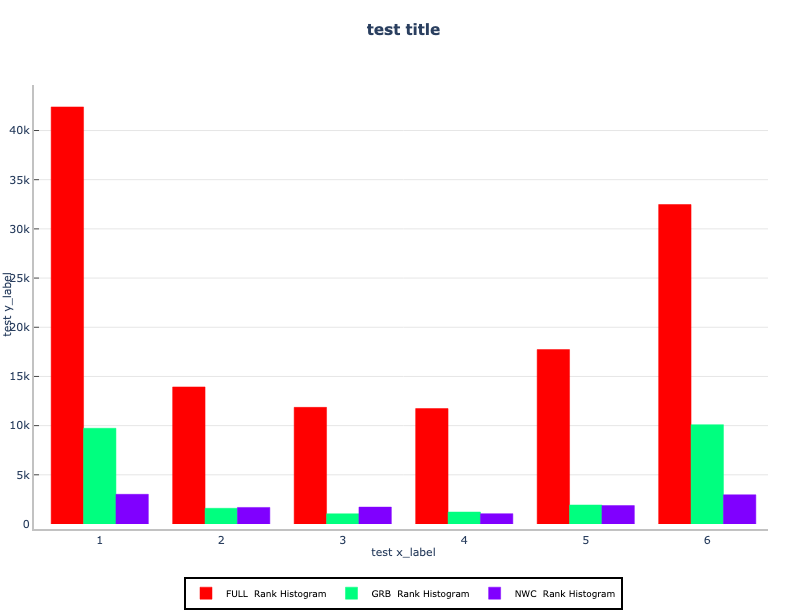
Rank histogram:
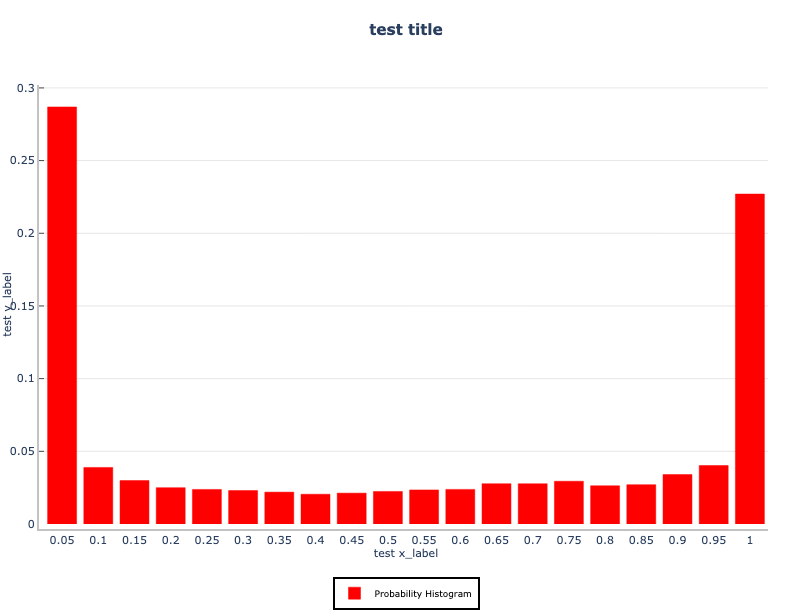
Probability histogram:
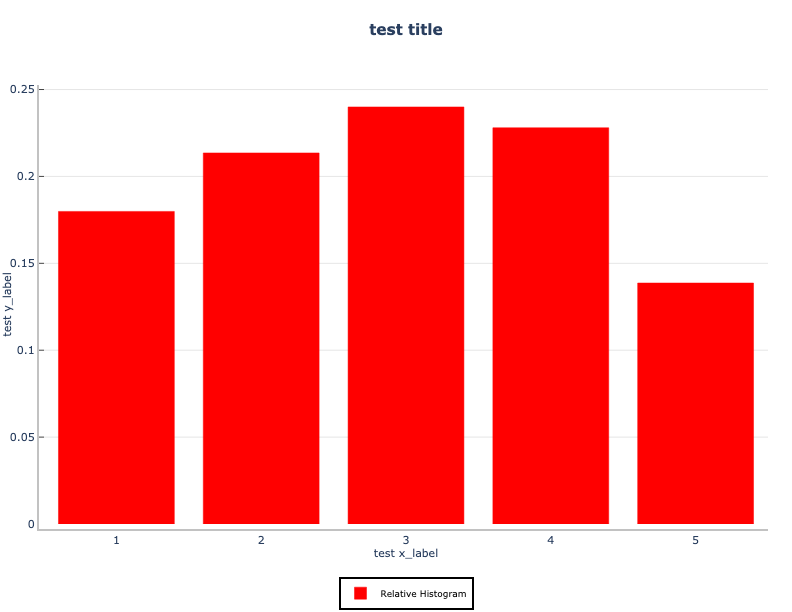
Relative Frequency histogram:
12.2. Example
12.2.1. Sample Data
The data is text output from MET in columnar format. The sample data used to create each of these “customized” plots is available in the METplotpy repository, where the histogram test scripts are located:
Rank Histogram:
$METPLOTPY_BASE/test/histogram/rank_hist.data
Probability Histogram:
$METPLOTPY_BASE/test/histogram/prob_hist.data
Relative Frequency Histogram:
$METPLOTPY_BASE/test/histogram/rel_hist.data
$METPLOTPY_BASE is the directory where the METplotpy code is saved:
e.g.
/usr/path/to/METplotpy if the source code was cloned or forked from the Github repository
or
/usr/path/to/METplotpy-x.y.z if the source code was downloaded as a zip or gzip’d tar file from the Release link of the Github repository. The x.y.z is the release number.
12.2.2. Configuration Files
Each histogram plot utilizes YAML configuration files to indicate where input data is located and to set plot attributes. These plot attributes correspond to values that can be set via the METviewer tool. YAML is a recursive acronym for “YAML Ain’t Markup Language” and according to yaml.org, it is a “human-friendly data serialization language. It is commonly used for configuration files and in applications where data is being stored or transmitted. Two configuration files are required. The first is a default configuration file, hist_defaults.yaml, which is found in the $METPLOTPY_BASE/metplotpy/plots/config directory. $METPLOTPY_BASE indicates the directory where the METplotpy source code has been saved. All default configuration files are located in the $METPLOTPY_BASE/metplotpy/plots/config directory. Default configuration files are automatically loaded by the plotting code and do not need to be explicitly specified when generating a plot.
The second required configuration file is a user-supplied “custom” configuration file to specify settings for the rank, probability, and relative frequency histograms. This file is used to customize/override the default settings in the hist_defaults.yaml file.
12.3. METplus Configuration
12.3.1. Default Configuration File
The following is the mandatory, hist_defaults.yaml configuration file, which serves as a starting point for creating a generic histogram plot, upon which the rank, probability, and relative frequency histograms will be built.
NOTE: This default configuration file is automatically loaded by histogram.py, rank_hist.py, prob_hist.py, and rel_hist.py.
caption_align: 0.0
caption_col: '#333333'
caption_offset: 3.0
caption_size: 0.8
caption_weight: 1
cex: 1
colors:
- '#ff0000'
con_series:
- 1
create_html: 'False'
dump_points_1: 'False'
event_equal: 'False'
fixed_vars_vals_input: {}
grid_col: '#cccccc'
grid_lty: 3
grid_lwd: 1
grid_on: 'True'
grid_x: listX
indy_label: []
indy_plot_val: []
indy_vals: []
indy_var: ''
legend_box: o
legend_inset:
  x: 0.0
  y: -0.25
legend_ncol: 1
legend_size: 0.8
line_type: None
list_stat_1: []
mar:
- 8.0
- 4.0
- 5.0
- 4.0
mgp:
- 1.0
- 1.0
- 0.0
normalized_histogram: 'True'
plot_caption: ''
plot_disp:
- 'True'
plot_height: 8.5
plot_res: 72
plot_stat: median
plot_type: png16m
plot_units: in
plot_width: 11.0
series_val_1: {}
series_order:
- 1
title: test title
title_align: 0.5
title_offset: -2
title_size: 1.4
title_weight: 2.0
user_legend: []
xaxis: test x_label
xaxis_reverse: 'False'
xlab_align: 0.5
xlab_offset: 2
xlab_size: 1
xlab_weight: 1
xlim: []
xtlab_decim: 0
xtlab_horiz: 0.5
xtlab_orient: 1
xtlab_perp: -0.75
xtlab_size: 1
yaxis_1: test y_label
ylab_align: 0.5
ylab_offset: -2
ylab_size: 1
ylab_weight: 1
ylim: []
ytlab_horiz: 0.5
ytlab_orient: 1
ytlab_perp: 0.5
ytlab_size: 1
12.3.2. Custom Configuration File
A second, mandatory configuration file is required, which is used to customize the settings to generate each of the specialized histograms. The rank_hist.yaml , rank_hist.yaml, and rank_hist.yaml files are included with the source code and look like the following:
Rank histogram config file:
stat_input: ./rank_hist.data
plot_filename: ./rank_hist.png

caption_align: 0.0
caption_col: '#333333'
caption_offset: 3.0
caption_size: 0.8
caption_weight: 1
cex: 1
colors:
- '#ff0000'
- '#00ff7f'
- '#8000ff'
con_series:
- 1
- 1
- 1
create_html: 'False'
dump_points_1: 'False'
event_equal: 'False'
fcst_var_val_1: null
fixed_vars_vals_input: {}
grid_col: '#cccccc'
grid_lty: 3
grid_lwd: 1
grid_on: 'True'
grid_x: listX
legend_box: o
legend_inset:
  x: 0.0
  y: -0.25
legend_ncol: 3
legend_size: 0.8
line_type: None
list_stat_1: []
list_stat_2: []
mar:
- 8.0
- 4.0
- 5.0
- 4.0
mgp:
- 1.0
- 1.0
- 0.0
normalized_histogram: 'False'
plot_caption: ''
plot_disp:
- 'True'
- 'True'
- 'True'
plot_height: 8.5
plot_res: 72
plot_type: png16m
plot_units: in
plot_width: 11.0

# Optional, uncomment and set to directory to store the .points1 file
# that is used by METviewer (created when dump_points_1 is set to True)
# if dump_points_1 is True and this is uncommented, the points1 file
# will be saved in the default location (i.e. where the input data file is stored).
#points_path: /dir_to_save_points1_file

series_order:
- 1
- 2
- 3

series_val_1:
  vx_mask:
  - FULL
  - GRB
  - NWC

sync_yaxes: 'False'
title: test title
title_align: 0.5
title_offset: -2
title_size: 1.4
title_weight: 2.0
user_legend: []
xaxis: test x_label
xaxis_reverse: 'False'
xlab_align: 0.5
xlab_offset: 2
xlab_size: 1
xlab_weight: 1
xlim: []
xtlab_decim: 0
xtlab_horiz: 0.5
xtlab_orient: 1
xtlab_perp: -0.75
xtlab_size: 1
yaxis_1: test y_label
ylab_align: 0.5
ylab_offset: -2
ylab_size: 1
ylab_weight: 1
ylim: []
ytlab_horiz: 0.5
ytlab_orient: 1
ytlab_perp: 0.5
ytlab_size: 1
Probability histogram config file:
stat_input: ./prob_hist.data
plot_filename: ./prob_hist.png

caption_align: 0.0
caption_col: '#333333'
caption_offset: 3.0
caption_size: 0.8
caption_weight: 1
cex: 1
colors:
- '#ff0000'
create_html: 'False'
dump_points_1: 'False'
event_equal: 'False'
fixed_vars_vals_input: {}
grid_col: '#cccccc'
grid_lty: 3
grid_lwd: 1
grid_on: 'True'
grid_x: listX
indy_label: []
indy_plot_val: []
indy_vals: []
indy_var: ''
legend_box: o
legend_inset:
  x: 0.0
  y: -0.25
legend_ncol: 1
legend_size: 0.8
line_type: None
list_stat_1: []
mar:
- 8.0
- 4.0
- 5.0
- 4.0
mgp:
- 1.0
- 1.0
- 0.0
normalized_histogram: 'True'
plot_caption: ''
plot_disp:
- 'True'
plot_height: 8.5
plot_res: 72
plot_type: png16m
plot_units: in
plot_width: 11.0

# Optional, uncomment and set to directory to store the .points1 file
# that is used by METviewer (created when dump_points_1 is set to True)
# if dump_points_1 is True and this is uncommented, the points1 file
# will be saved in the default location (i.e. where the input data file is stored).
#points_path: /dir_to_save_points1_file

series_order:
- 1
series_val_1: {}
show_nstats: 'False'
title: test title
title_align: 0.5
title_offset: -2
title_size: 1.4
title_weight: 2.0
user_legend: []
xaxis: test x_label
xaxis_reverse: 'False'
xlab_align: 0.5
xlab_offset: 2
xlab_size: 1
xlab_weight: 1
xlim: []
xtlab_decim: 0
xtlab_horiz: 0.5
xtlab_orient: 1
xtlab_perp: -0.75
xtlab_size: 1
yaxis_1: test y_label
ylab_align: 0.5
ylab_offset: -2
ylab_size: 1
ylab_weight: 1
ylim: []
ytlab_horiz: 0.5
ytlab_orient: 1
ytlab_perp: 0.5
ytlab_size: 1
Relative frequency histogram config file:
plot_filename: ./rel_hist.png
stat_input: ./rel_hist.data


caption_align: 0.0
caption_col: '#333333'
caption_offset: 3.0
caption_size: 0.8
caption_weight: 1
cex: 1
colors:
- '#ff0000'
con_series:
- 1
create_html: 'False'
dump_points_1: 'False'
event_equal: 'False'
fixed_vars_vals_input: {}
grid_col: '#cccccc'
grid_lty: 3
grid_lwd: 1
grid_on: 'True'
grid_x: listX
indy_label: []
indy_plot_val: []
indy_vals: []
indy_var: ''
legend_box: o
legend_inset:
  x: 0.0
  y: -0.25
legend_ncol: 1
legend_size: 0.8
line_type: None
list_stat_1: []
mar:
- 8.0
- 4.0
- 5.0
- 4.0
mgp:
- 1.0
- 1.0
- 0.0
normalized_histogram: 'True'
plot_caption: ''
plot_disp:
- 'True'
plot_height: 8.5
plot_res: 72
plot_stat: median
plot_type: png16m
plot_units: in
plot_width: 11.0

# Optional, uncomment and set to directory to store the .points1 file
# that is used by METviewer (created when dump_points_1 is set to True)
# if dump_points_1 is True and this is uncommented, the points1 file
# will be saved in the default location (i.e. where the input data file is stored).
#points_path: /dir_to_save_points1_file

series_val_1: {}
series_order:
- 1
title: test title
title_align: 0.5
title_offset: -2
title_size: 1.4
title_weight: 2.0
user_legend: []
xaxis: test x_label
xaxis_reverse: 'False'
xlab_align: 0.5
xlab_offset: 2
xlab_size: 1
xlab_weight: 1
xlim: []
xtlab_decim: 0
xtlab_horiz: 0.5
xtlab_orient: 1
xtlab_perp: -0.75
xtlab_size: 1
yaxis_1: test y_label
ylab_align: 0.5
ylab_offset: -2
ylab_size: 1
ylab_weight: 1
ylim: []
ytlab_horiz: 0.5
ytlab_orient: 1
ytlab_perp: 0.5
ytlab_size: 1
Copy each of these “custom” config files from the directory where the source code was saved to the working directory:
For the rank histogram configuration file
cp $METPLOTPY_BASE/test/histogram/rank_hist.yaml $WORKING_DIR/rank_hist.yaml
For the probability histogram configuration file
cp $METPLOTPY_BASE/test/histogram/prob_hist.yaml $WORKING_DIR/prob_hist.yaml
For the relative frequency histogram configuration file
cp $METPLOTPY_BASE/test/histogram/rel_hist.yaml $WORKING_DIR/rel_hist.yaml
Modify the stat_input setting in the
$METPLOTPY_BASE/test/histogram/rank_hist.yaml file to explicitly point to the $METPLOTPY_BASE/test/histogram/histogram directory (where the custom config files and sample data reside).
Modify the stat_input setting in the
$METPLOTPY_BASE/test/histogram/prob_hist.yaml file to explicitly point to the $METPLOTPY_BASE/test/histogram/histogram directory (where the custom config files and sample data reside).
Modify the stat_input setting in the
$METPLOTPY_BASE/test/histogram/rel_hist.yaml file to explicitly point to the $METPLOTPY_BASE/test/histogram/histogram directory (where the custom config files and sample data reside).
In the $METPLOTPY_BASE/test/histogram/rank_hist.yaml file, replace the relative path ./rank_hist.data with the full path $METPLOTPY_BASE/test/histogram/rank_hist.data for the rank histogram config file (including replacing $METPLOTPY_BASE with the full path to the METplotpy installation on the system)..
In the $METPLOTPY_BASE/test/histogram/prob_hist.yaml file, replace the relative path ./prob_hist.data with the full path $METPLOTPY_BASE/test/histogram/prob_hist.data (including replacing $METPLOTPY_BASE with the full path to the METplotpy installation on the system) for the probability histogram config file.
In the $METPLOTPY_BASE/test/histogram/rel_hist.yaml file, replace the relative path ./rel_hist.data with the full path $METPLOTPY_BASE/test/histogram/rel_hist.data (including replacing $METPLOTPY_BASE with the full path to the METplotpy installation on the system) for the relative frequency histogram config file.
Modify the plot_filename setting to point to the output path where the plot will be saved, including the name of the plot.
For example
For the rank histogram:
stat_input: /username/myworkspace/METplotpy/test/histogram/rank_hist.data
plot_filename: /username/working_dir/output_plots/rank_hist.png
For the probability histogram:
stat_input: /username/myworkspace/METplotpy/test/histogram/prob_hist.data
plot_filename: /username/working_dir/output_plots/prob_hist.png
For the relative frequency histogram:
stat_input: /username/myworkspace/METplotpy/test/histogram/rel_hist.data
plot_filename: /username/working_dir/output_plots/rel_hist.png
This is where /username/myworkspace/METplotpy is $METPLOTPY_BASE and /username/working_dir is $WORKING_DIR. Make sure that the $WORKING_DIR directory that is specified exists and has the appropriate read and write permissions. The path listed for plot_filename may be changed to the output directory of one’s choosing. If this is not set, then the plot_filename setting specified in the $METPLOTPY_BASE/metplotpy/plots/config/hist_defaults.yaml configuration file will be used.
To save the intermediate .points1 file (used by METviewer and useful for debugging), set the dump_points_1 setting to True (in the config file corresponding to the specialized histogram plot where you wish to save intermediate points). Uncomment or add (if it doesn’t exist) the points_path setting:
dump_points_1: ‘True’
points_path: ‘/dir_to_save_points1_file’
Replace the /dir_to_save_points1_file to the same directory where the .points1 file is saved. If points_path is commented out (indicated by a ‘#’ symbol in front of it), remove the ‘#’ symbol to uncomment the points_path so that it will be used by the code. Make sure that this directory exists and has the appropriate read and write permissions. NOTE: the points_path setting is optional and does not need to be defined in the configuration file unless saving the intermediate .points1 file is desired.
12.4. Run from the Command Line
To generate the three specialized histogram plots (i.e. using settings in the hist_defaults.yaml configuration file), perform the following:
If using the conda environment, verify the conda environment is running and has has the required Python packages outlined in the requirements section.
Set the METPLOTPY_BASE environment variable to point to $METPLOTPY_BASE.
For the ksh environment:
export METPLOTPY_BASE=$METPLOTPY_BASE
For the csh environment:
setenv METPLOTPY_BASE $METPLOTPY_BASERecall that $METPLOTPY_BASE is the directory path indicating where the METplotpy source code was saved.
Run the following on the command line:
To generate the rank histogram:
python $METPLOTPY_BASE/metplotpy/plots/histogram/rank_hist.py $WORKING_DIR/rank_hist.yamlThis will create a PNG file, rank_hist.png, in the directory that was specified in the plot_filename setting of the minimal_histogram.yaml config file:
To generate the probability histogram, re-run the above command using the prob_hist.yaml file:
python $METPLOTPY_BASE/metplotpy/plots/histogram/prob_hist.py $WORKING_DIR/prob_hist.yaml
- To generate the relative frequency histogram, re-run the above
command using the rel_hist.yaml file:
python $METPLOTPY_BASE/metplotpy/plots/histogram/rel_hist.py $WORKING_DIR/rel_hist.yaml
A rank_hist.png output file will be created in the directory that was specified in the plot_filename config setting in the rank_hist.yaml config file.
A prob_hist.png output file will be created in the the directory that was specified in the plot_filename config setting in the prob_hist.yaml config file.
A rel_hist.png output file will be created in the the directory that was specified in the plot_filename config setting in the rel_hist.yaml config file.