4. Bar plot
4.1. Description
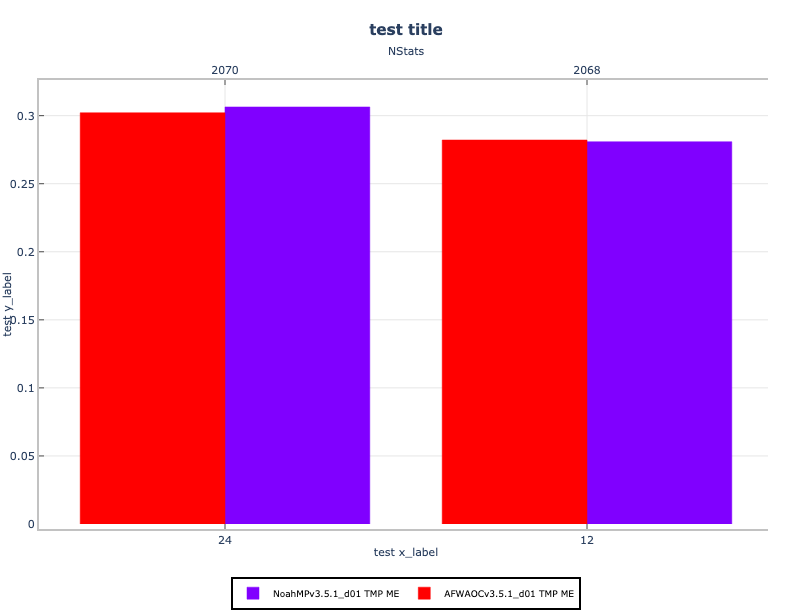
A bar plot shows comparisons among discrete categories. One axis of the chart shows the specific categories being compared, while the other represents some measured value. The heights or lengths are proportional to the values that they represent. Bar plots are simple and flexible, unlike some other METview plot types. Rather than using prescribed statistics in a specific way, the user can select both axes.
Bar plots are distinct from histograms and the two are not interchangeable. Histograms show the frequency of occurrence of values in discrete categories (that are sometimes created by binning continuous values). To create a histogram, the user may only select the variable for a single axis. In a bar plot, two axis values are selected by the user, one categorical and one numeric.
Bar plots often represent counts or frequencies, however, bar plots can represent means, medians, standard deviations, or any other statistic. Refer to the METviewer documentation for details on how this plot is utilized.
4.2. Example
4.2.1. Sample Data
The sample data used to create an example bar plot is available in the METplotpy repository, where the bar plot tests are located:
$METPLOTPY_BASE/metplotpy/test/bar/bar.data
$METPLOTPY_BASE is the directory where the METplotpy code is saved. The data is text output from MET in columnar format.
e.g.
/usr/path/to/METplotpy if the source code was cloned or forked from the Github repository
or
/usr/path/to/METplotpy-x.y.z if the source code was downloaded as a zip or gzip’d tar file from the Release link of the Github repository. The x.y.z is the release number.
4.2.2. Configuration Files
The bar plot utilizes YAML configuration files to indicate where input data is located and to set plot attributes. These plot attributes correspond to values that can be set via the METviewer tool. YAML is a recursive acronym for “YAML Ain’t Markup Language” and according to yaml.org, it is a “human-friendly data serialization language”. It is commonly used for configuration files and in applications where data is being stored or transmitted. Two configuration files are required. The first is a default configuration file, bar_defaults.yaml, which is found in the $METPLOTPY_BASE/metplotpy/plots/config directory. All default configuration files are located in the $METPLOTPY_BASE/metplotpy/plots/config directory. $METPLOTPY_BASE is base directory where the METplotpy source code has been saved. Default configuration files are automatically loaded by the plotting code and do not need to be explicitly specified when generating a plot.
The second required configuration file is a user-supplied “custom” configuration file. This file is used to customize/override the default settings in the bar_defaults.yaml file. The custom configuration file can be an empty file if all default settings are to be applied.
4.3. METplus Configuration
4.3.1. Default Configuration File
The following is the mandatory, bar_defaults.yaml configuration file, which serves as a good starting point for creating a line plot as it represents the default values set in METviewer.
NOTE: This default configuration file is automatically loaded by bar.py.
alpha: 0.05
caption_align: 0
caption_col: '#333333'
caption_offset: 3
caption_size: 0.8
caption_weight: 1
cex: 1
colors: []
con_series: []
derived_series_1: []
dump_points_1: 'False'
event_equal: 'False'
fcst_var_val_1: {}
fixed_vars_vals_input: {}
grid_col: '#f5274a'
grid_lty: 3
grid_lwd: 1
grid_on: 'True'
grid_x: listX
indy_vals: []
indy_var: ''
legend_box: o
legend_inset:
  x: 0.0
  y: -0.25
legend_ncol: 3
legend_size: 0.8
log_filename: stdout
log_level: ERROR
line_type: N/A
list_stat_1: []
list_stat_2: []
mar:
- 8
- 4
- 5
- 4
method: ''
mgp:
- 1
- 1
- 0
plot_disp: []
plot_filename: /tmp/bar.png
plot_height: 8.5
plot_res: 72
plot_stat: median
plot_type: png16m
plot_units: in
plot_width: 11.0
series_line_width: []
series_order: []
series_val_1: {}
show_nstats: 'False'
sync_yaxes: 'False'
title: test title
title_align: 0.5
title_offset: -2
title_size: 1.4
title_weight: 2.0
user_legend: []
x2lab_align: 0.5
x2lab_offset: -0.5
x2lab_size: 0.8
x2lab_weight: 1
x2tlab_horiz: 0.5
x2tlab_orient: 1
x2tlab_perp: 1
x2tlab_size: 0.8
xaxis: test x_label
xaxis_reverse: 'False'
xlab_align: 0.5
xlab_offset: 2
xlab_size: 1
xlab_weight: 1
xlim: []
xtlab_decim: 0
xtlab_horiz: 0.5
xtlab_orient: 1
xtlab_perp: -0.75
xtlab_size: 1
yaxis_1: test y_label
ylab_align: 0.5
ylab_offset: -2
ylab_size: 1
ylab_weight: 1
ylim: []
ytlab_horiz: 0.5
ytlab_orient: 1
ytlab_perp: 0.5
ytlab_size: 1
In the default config file, logging is set to stdout and the log level is ERROR (i.e. only log messages of type ERROR will be logged). If the log_filename and log_level are not specified in the custom configuration file, these settings will be used.
4.3.2. Custom Configuration File
A second, mandatory configuration file is required, which is used to customize the settings to the bar plot. The custom_bar.yaml file is included with the source code. If the user wishes to use all the default settings defined in the bar_defaults.yaml file, an empty custom configuration file can be specified instead.
alpha: 0.05
caption_align: 0.0
caption_col: '#333333'
caption_offset: 3.0
caption_size: 0.8
caption_weight: 1
cex: 1
circular_block_bootstrap: 'True'
colors:
- '#ff0000'
- '#8000ff'
con_series:
- 1
- 1
create_html: 'False'
derived_series_1: []
dump_points_1: 'True'
eqbound_high: 0.001
eqbound_low: -0.001
event_equal: 'False'
fcst_var_val_1:
  TMP:
  - ME
fixed_vars_vals_input: {}
grid_col: '#cccccc'
grid_lty: 3
grid_lwd: 1
grid_on: 'True'
grid_x: listX
indy_label:
- '12'
- '24'
indy_vals:
- '120000'
- '240000'
indy_var: fcst_lead
legend_box: o
legend_inset:
  x: 0.0
  y: -0.25
legend_ncol: 3
legend_size: 0.8
line_type: None
list_stat_1:
- ME
mar:
- 8
- 4
- 5
- 4
method: bca
mgp:
- 1
- 1
- 0
num_iterations: 1
num_threads: -1
plot_caption: ''
plot_disp:
- 'True'
- 'True'
plot_height: 8.5
plot_res: 72
plot_stat: median
plot_type: png16m
plot_units: in
plot_width: 11.0

# Optional, uncomment and set to directory to store the .points1 file
# that is used by METviewer (created when dump_points_1 is set to True)
# if dump_points_1 is True and this is uncommented, the points1 file
# will be saved in the default location (i.e. where the input data file is stored).
#points_path: /dir_to_save_points1_file

random_seed: null

series_order:
- 1
- 2


series_val_1:
  model:
  - AFWAOCv3.5.1_d01
  - NoahMPv3.5.1_d01
series_val_2: {}
show_nstats: 'True'

sync_yaxes: 'False'
title: test title
title_align: 0.5
title_offset: -2
title_size: 1.4
title_weight: 2.0
user_legend: []
vert_plot: 'False'
x2lab_align: 0.5
x2lab_offset: -0.5
x2lab_size: 0.8
x2lab_weight: 1
x2tlab_horiz: 0.5
x2tlab_orient: 1
x2tlab_perp: 1
x2tlab_size: 0.8
xaxis: test x_label
xaxis_reverse: 'True'
xlab_align: 0.5
xlab_offset: 2
xlab_size: 1
xlab_weight: 1
xlim: []
xtlab_decim: 0
xtlab_horiz: 0.5
xtlab_orient: 1
xtlab_perp: -0.75
xtlab_size: 1
y2lab_align: 0.5
y2lab_offset: 1
y2lab_size: 1
y2lab_weight: 1
y2lim: []
y2tlab_horiz: 0.5
y2tlab_orient: 1
y2tlab_perp: 1
y2tlab_size: 1.0
yaxis_1: test y_label
yaxis_2: ''
ylab_align: 0.5
ylab_offset: -2
ylab_size: 1
ylab_weight: 1
ylim: []
ytlab_horiz: 0.5
ytlab_orient: 1
ytlab_perp: 0.5
ytlab_size: 1

stat_input: ./bar.data
plot_filename: ./bar.png

# To save your log output to a file, specify a path and filename and uncomment the line below.  Make sure you have
# permissions to the directory you specify.  The default, as specified in the default config file is stdout.
#log_filename: ./bar.log

# To change the log level, specify a log level: debug, info, warning, error and uncomment the line below.
#  Debug and info log level will produce more log output.
#log_level: WARNING
Copy this custom config file from the directory where the source code was saved to the working directory:
cp $METPLOTPY_BASE/test/bar/custom_bar.yaml $WORKING_DIR/custom_bar.yaml
Modify the stat_input setting in the $METPLOTPY_BASE/test/bar/custom_bar.yaml file to explicitly point to the $METPLOTPY_BASE/test/bar directory by replacing the relative paths (e.g. ./bar.data) with the full path $METPLOTPY_BASE/test/bar/bar.data (including replacing $METPLOTPY_BASE with the full path to the METplotpy installation on the system). Modify the plot_filename setting to explicitly point to the directory of the plot, using the full path, including the name of the plot.
For example:
stat_input: /username/myworkspace/METplotpy/test/bar.data
plot_filename: /username/working_dir/output_plots/bar.png
This is where /username/myworkspace/METplotpy corresponds to $METPLOTPY_BASE and /username/working_dir corresponds to $WORKING_DIR. Make sure that the $WORKING_DIR directory that is specifed exists and has the appropriate read and write permissions. The path listed for plot_filename may be changed to the output directory of one’s choosing. If this is not set, then the plot_filename setting specified in the $METPLOTPY_BASE/metplotpy/plots/config/bar_defaults.yaml configuration file will be used.
To save the intermediate .points1 file (used by METviewer and useful for debugging), set the dump_points_1 setting to True. Uncomment or add (if it doesn’t exist) the points_path setting.
dump_points_1: ‘True’
points_path: ‘/dir_to_save_points1_file’
Replace the /dir_to_save_points1_file to the same directory where the .points1 file is saved. If points_path is commented out (indicated by a ‘#’ symbol in front of it), remove the ‘#’ symbol to uncomment the points_path so that it will be used by the code. Make sure that this directory exists and has the appropriate read and write permissions. NOTE: the points_path setting is optional and does not need to be defined in the configuration file unless saving the intermediate .points1 file is desired.
To save the log output to a file, uncomment the log_filename entry and specify the path and name of the log file. Select a directory with the appropriate read and write privileges. To modify the verbosity of logging than what is set in the default config file, uncomment the log_level entry and specify the log level (debug and info are higher verbosity, warning and error are lower verbosity).
4.4. Run from the Command Line
The custom_bar.yaml configuration file, in combination with the bar_defaults.yaml configuration file, generates a bar plot:
To generate the above bar plot, perform the following:
If using the conda environment, verify the conda environment is running and has has the required Python packages outlined in the requirements section.
Set the METPLOTPY_BASE environment variable to point to $METPLOTPY_BASE
For the ksh environment:
export METPLOTPY_BASE=$METPLOTPY_BASE
For the csh environment:
setenv METPLOTPY_BASE $METPLOTPY_BASERecall that $METPLOTPY_BASE is the directory path indicating where the METplotpy source code was saved.
Enter the following command:
python $METPLOTPY_BASE/metplotpy/plots/bar/bar.py $WORKING_DIR/custom_bar.yamlA bar.png output file will be created in the directory that was specified in the plot_filename configuration setting in the custom_bar.yaml config file.